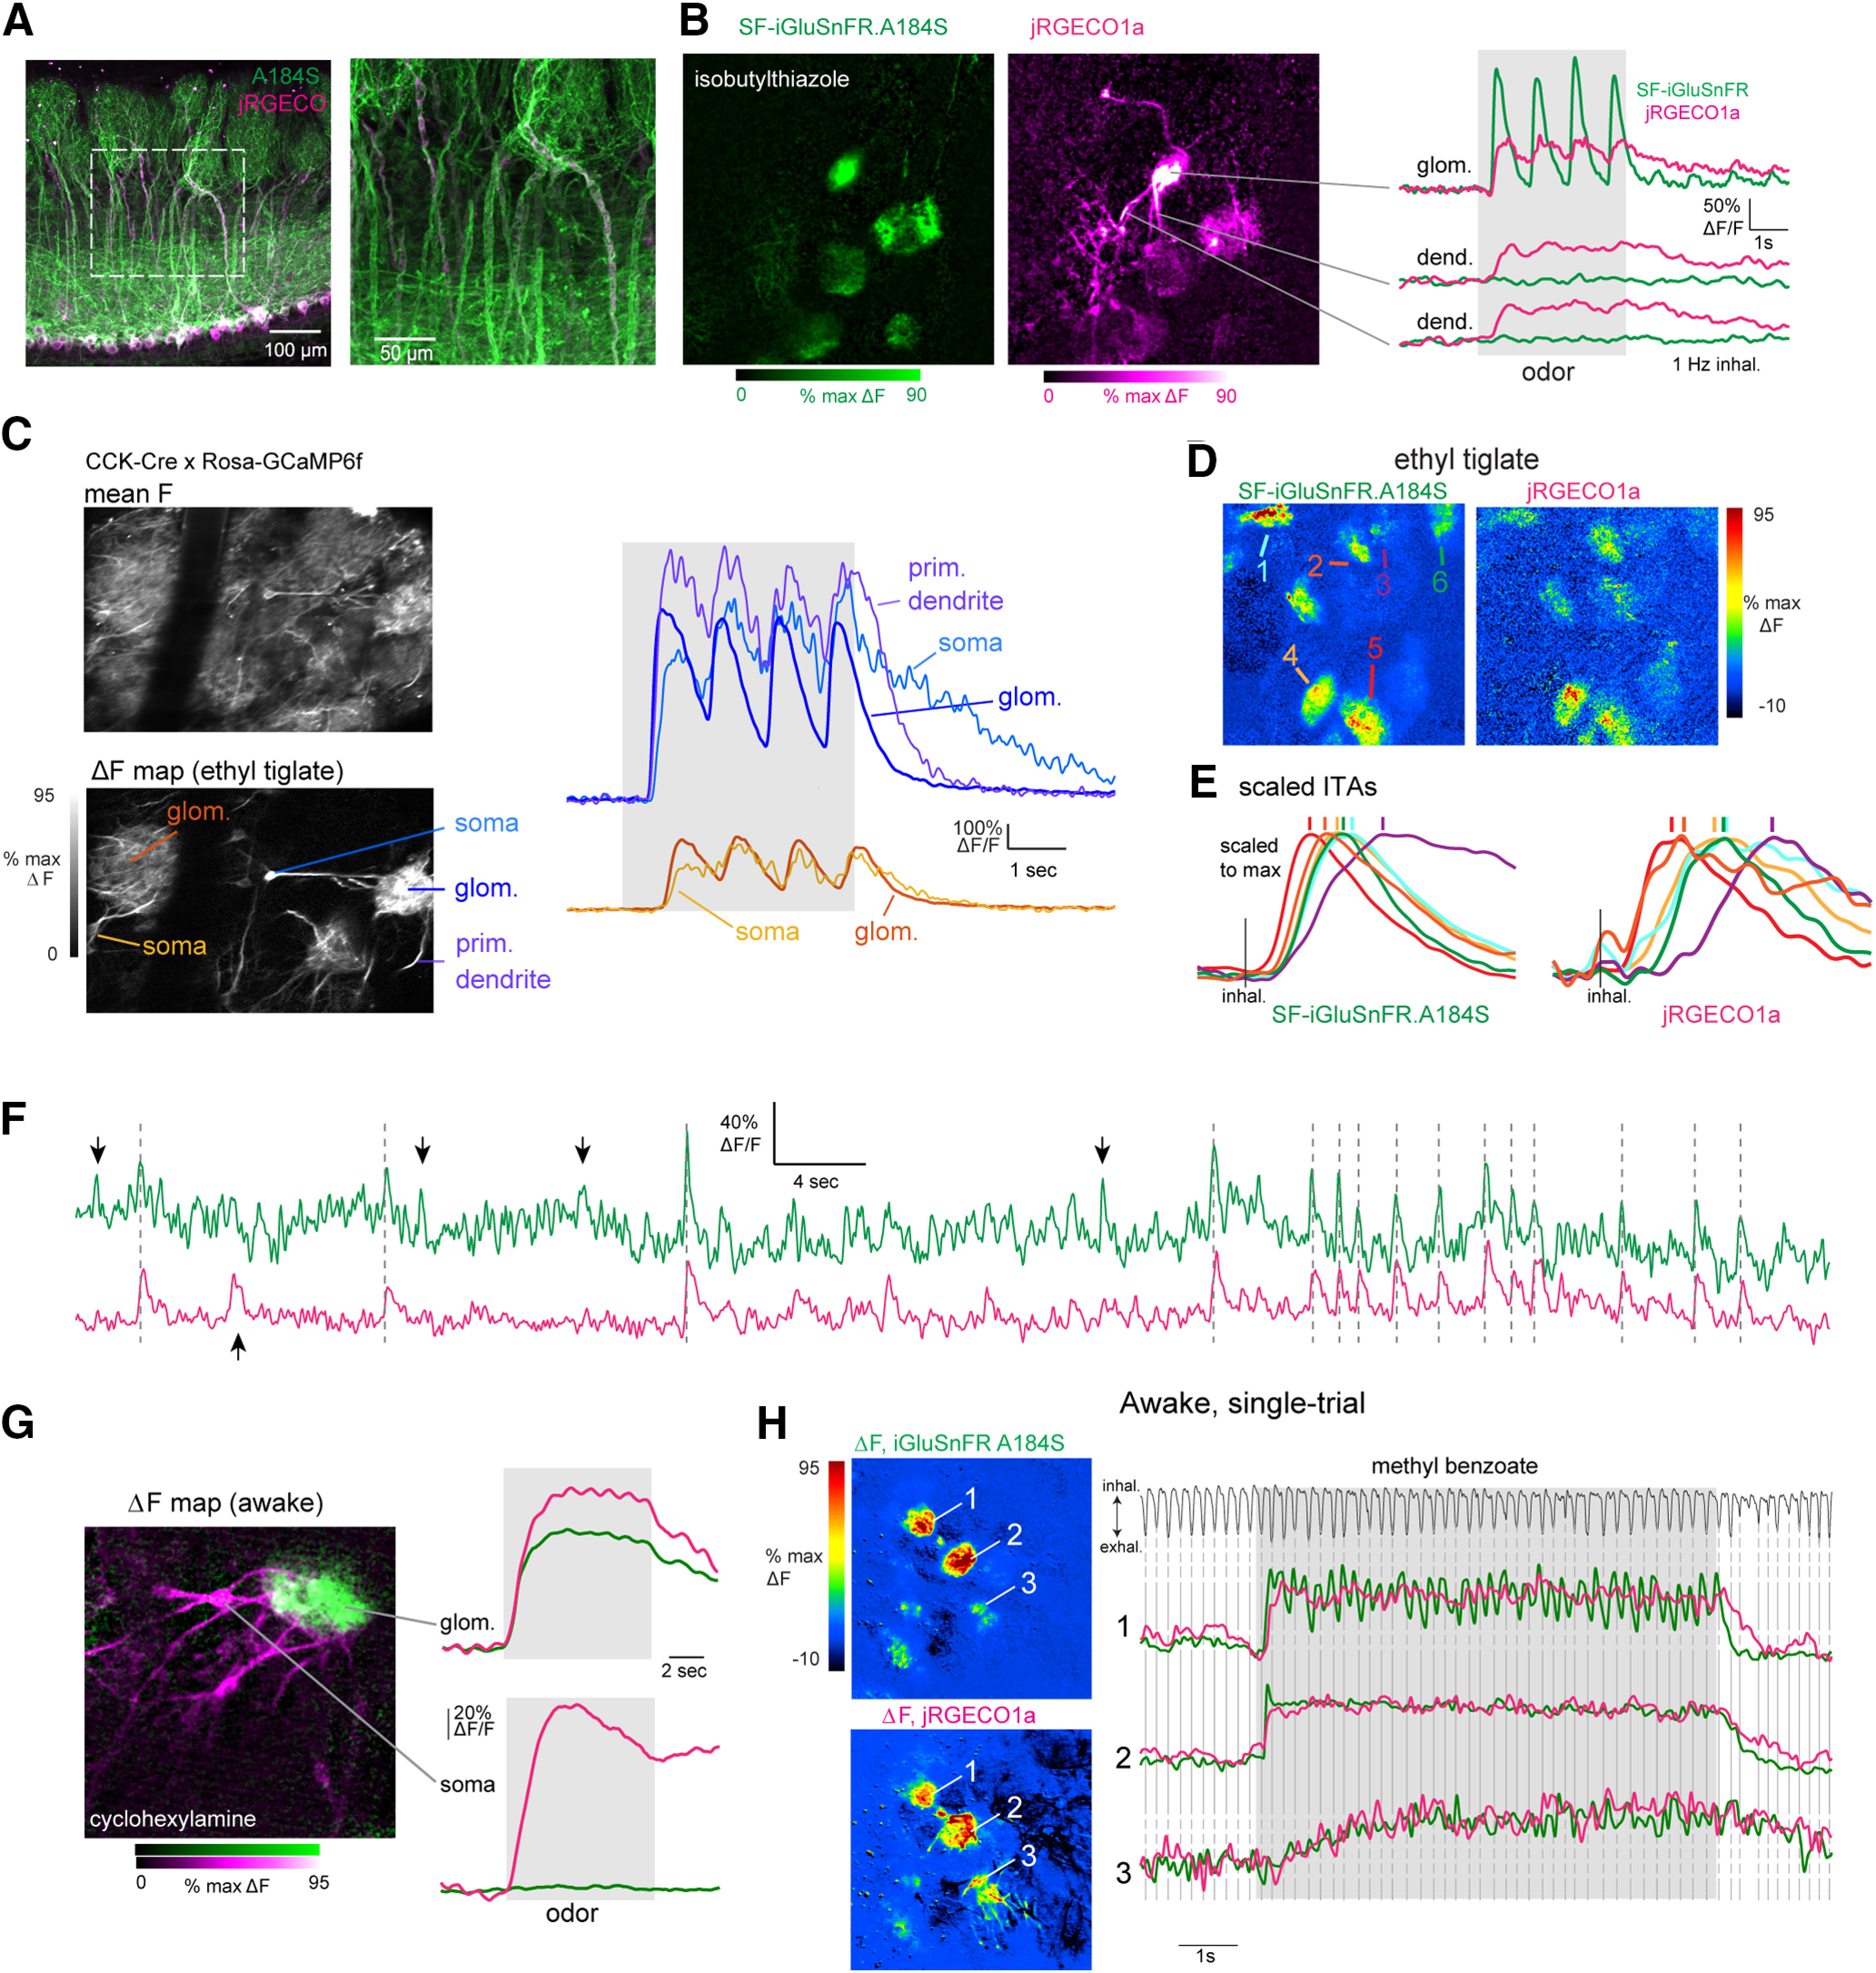
Figure 6.

Dual-color imaging reveals high correspondence between presynaptic and postsynaptic signals in MT cells of the same glomerulus. A, Post hoc confocal image showing coexpression of jRGECO1a (magenta) and SF-iGluSnFR.A184S (A184S, green) in MT cells of a Tbet-Cre mouse. B, Dual-color two-photon imaging of SF.iGluSnFR.A184S and jRGECO1a signals from MT cells. Left, Odorant-evoked ΔF response maps for SF-iGluSnFR and jRGECO1a signals (magenta imaged simultaneously). Note jRGECO1a signal in dendrites of several MT cells exiting the central glomerulus, with SF-iGluSnFR signal confined to the glomerular neuropil. Right, Traces showing time course of the fluorescence signal in each channel (1-Hz inhalation). Top traces are from glomerular neuropil; lower traces are from dendrites outside of the glomerulus. C, High correspondence in calcium signals imaged from different MT cell subcompartments. Left, Images show mean fluorescence and ΔF odorant response map (ethyl tiglate) for GCaMP6f signals imaged in a CCK-IRES-Cre: Rosa-GCaMP6f cross. Right, Overlaid traces showing time course of GCaMP6f signal from the neuropile of two glomeruli (blue, orange traces) and, for each, the soma of a tufted cell innervating each glomerulus. For the glomerulus on the right, the signal from the primary dendrite of a second tufted cell innervating the same glomerulus is also shown. Near-synchronous, inhalation-driven transients are seen in all compartments, with a slightly slower rise and slower decay in the somata. Latency differences between the two glomeruli are also present in their respective cells’ somata. D, Pseudocolor odorant-evoked ITA response maps across the green (A184S) and red (jRGECO1a) channels. Arrows indicate ROIs with traces plotted in D. E, ITA traces taken from different glomeruli activated by the odorant in C, with different onset latencies, times to peak and durations in different glomeruli. Left traces, SF-iGluSnFR.A184S. Right traces, jRGECO1a; traces from the same glomerulus are shown with the same color in each set. Each ITA trace is scaled to the same maximum. Vertical lines indicate peak time for the signal in each glomerulus. The relative order of peak times is the same for both signals. F, Traces showing SF-iGluSnFR.A184V and jRGECO1a signals imaged simultaneously from a glomerulus, with high correspondence between spontaneously-occurring transients in the absence of odorant stimulation. Vertical lines mark transients seen in both signals; downward arrows mark transients seen in the green (A184S) but not red (jRGECO1a) channels; upward arrow marks transient seen in the red but not the green channel. G, Dual-color imaging of SF.iGluSnFR.A184S and jRGECO1a signals from MT cells in the awake mouse. Left, Composite dual-color ΔF response map showing SF-iGluSnFR (green) and jRGECO1a (magenta) signals evoked by cyclohexylamine. Right, Traces showing fluorescence signal taken from the glomerular neuropile (top) and soma (bottom) of an innervating TC. Traces are average of eight presentations. H, Trial-averaged ΔF response maps and traces for SF-iGluSnFR.A184S and jRGECO1a signals imaged from a single presentation of odorant in an awake mouse. Top trace shows respiration measured via external flow sensor. The SF-iGluSnFR signal clearly follows each inhalation in only one of the three glomeruli shown, while the jRGECO1a signal does not follow inhalations in any glomeruli.
