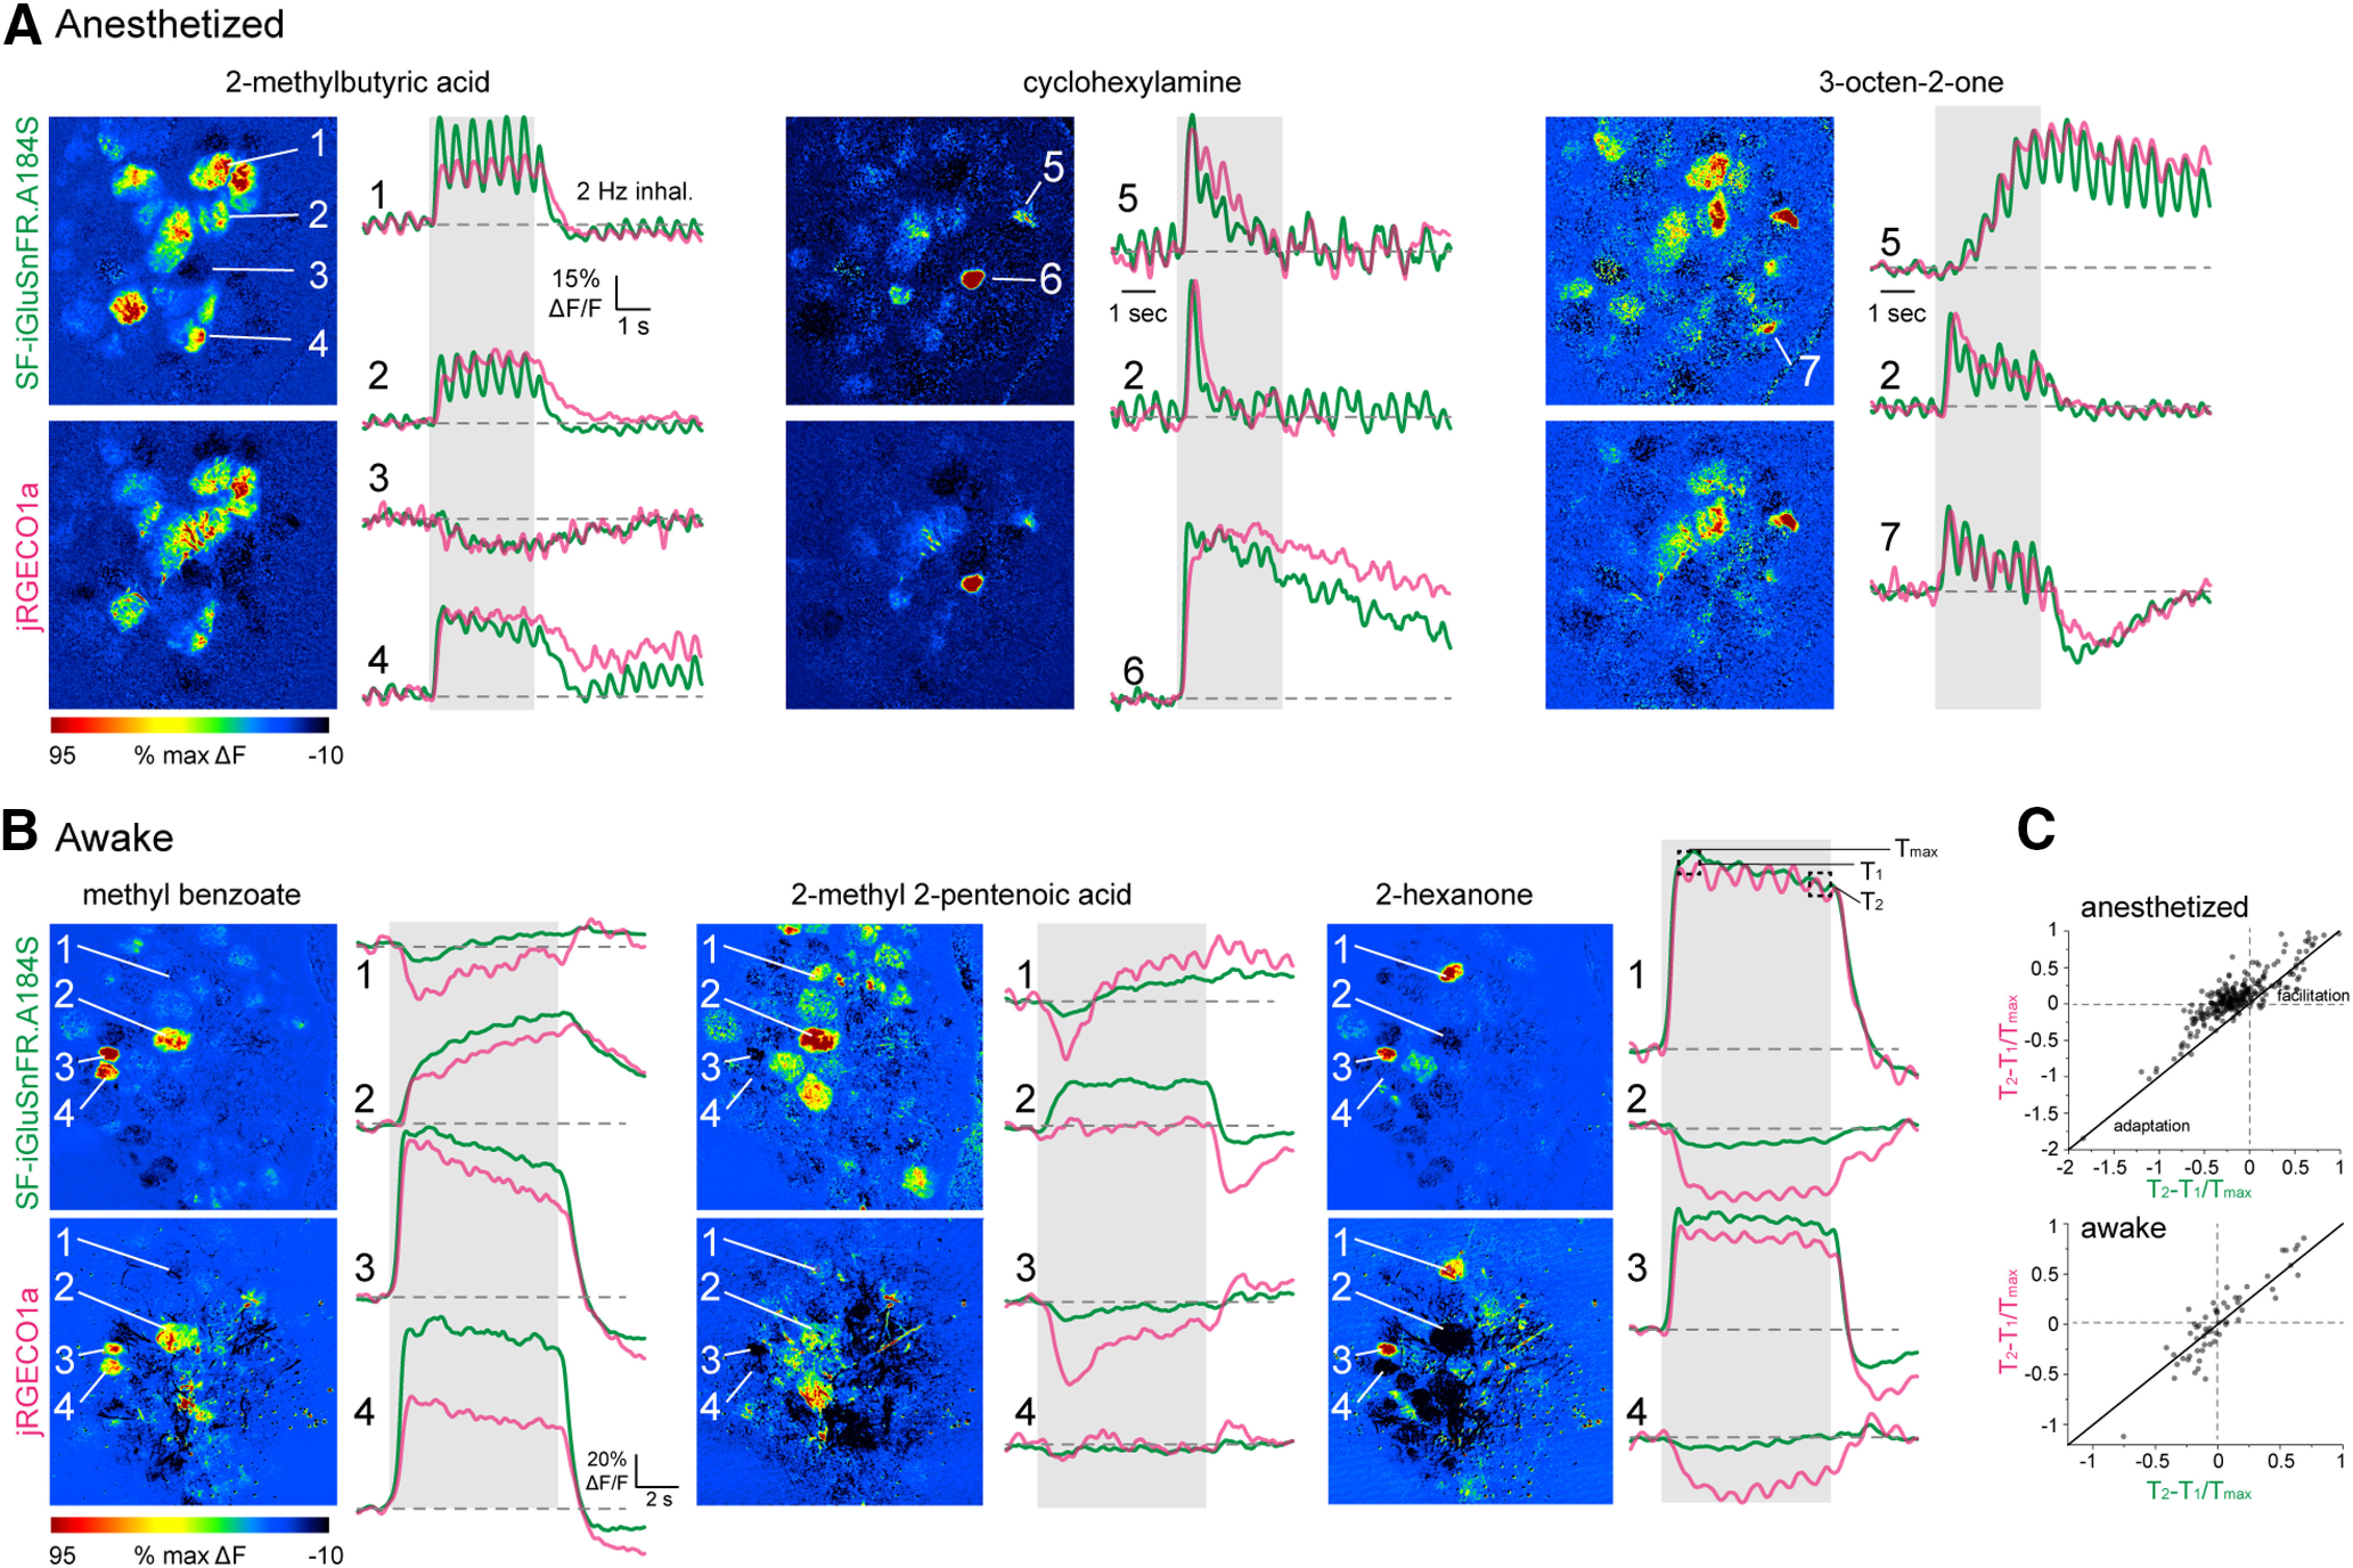
Figure 7.

High correspondence between odorant-evoked temporal patterns of glutamate signaling and calcium activity in MT cells of the same glomerulus. A, ΔF response maps (left) and trial-averaged SF-iGluSnFR.A184S and jRGECO1a signals imaged from select glomeruli for three odorants, illustrating high correspondence in slow response dynamics. Traces are average of four presentations in the same anesthetized mouse. Numbers indicate different glomeruli. Traces for cyclohexylamine and 3-octen-2-one are scaled to the same maximum. B, ΔF response maps and trial-averaged SF-iGluSnFR.A184S and jRGECO1a responses taken from four glomeruli in response to three odorants in an awake mouse. Traces are average of 16 presentations. Note distinct response patterns for the same glomerulus in response to different odorants, but, with a few exceptions, similar response patterns for SF-iGluSnFR and jRGECO1a signals. C, High correlation between T2 - T1/Tmax values measured for excitatory SF-iGluSnFR and jRGECO1a responses in the same glomerulus in anesthetized (top) or awake mice (bottom).
