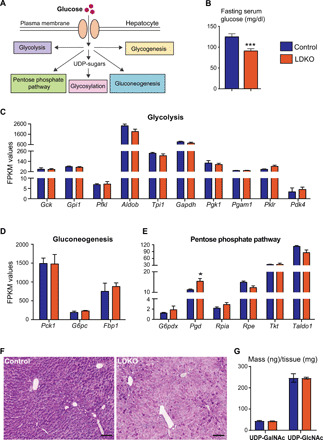
Fig. 4. LDKO livers exhibit any depleted glycogen stores.

(A) Schematic figure displaying the fate of glucose in a hepatocyte. (B) LDKO mice have reduced fasting blood glucose levels (n = 12 to 15 mice per group; Student t test, ***P < 0.005). Bar graphs comparing FPKM values of genes regulating (C) glycolysis, (D) gluconeogenesis, and (E) pentose phosphate pathway show no significant difference between control and LDKO livers (n = 3 mice per group; Student t test, *P < 0.05). (F) PAS staining indicates lower glycogen content in LDKO livers (n = 5 mice per group). Scale bars, 50 μm). (G) UDP-glycan sugars are not altered in LDKO livers (n = 5 mice per group, Student t test).
