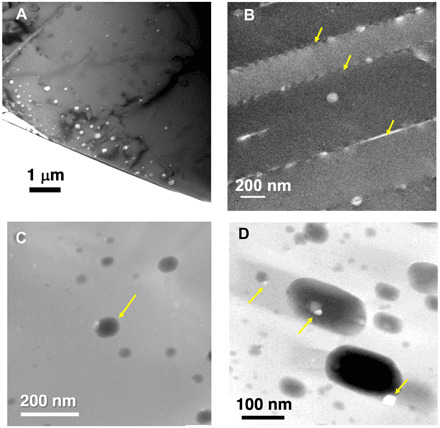
Fig. 2. TEM images of nanosized inclusions in calcite.

Some nanosized inclusions are distributed as bands [(A): bright-field (BF) image of CC-15] and along twin boundaries [(B): arrows, BF image of calcite CC-6]. One inclusion [(C): arrow, STEM image of C7K] has extra diffraction spots in cryo-TEM observation (Fig. 3). Nanosized inclusions have ovoidal shapes with facets [(D): STEM image of CC-7]. Tiny faceted objects as trapped or daughter crystals are observed [(C) and arrows in (D); see also fig. S3].
