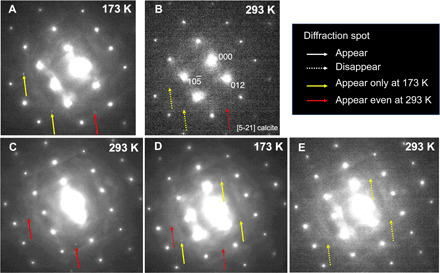
Fig. 3. Change in SAED patterns of a nanosized inclusion in cryo-TEM.

SAED patterns of an area including a nanosized inclusion in Fig. 2C (arrow) cooled at 173 K (A), raised to 293 K (B), kept for 33 days at 293 K (C), cooled again at 173 K (D), and raised to 293 K (E) are shown. Yellow and red arrows show that spots appeared only at 173 K and after keeping the sample at 293 K, respectively.
