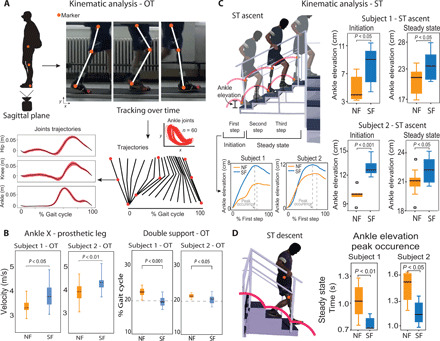
Fig. 5. Reshaping of kinematics toward a more physiological gait.

(A) During OT, main joints markers of the prosthetic leg and of the healthy leg were tracked over time from the sagittal plane. The trajectories, peaks occurrences, and velocities were calculated for each subject. (B) For both subjects, horizontal ankle velocities of the prosthetic leg were different in SF with respect to NF (n = 24 per condition). Double support as percentage of gait cycle is presented for both subjects in NF and in SF. Dashed line indicates reference normative value. n = 46 for subject 1 and n = 30 for subject 2 per condition. (C) During ST, the leg markers of the prosthetic leg were tracked. Ankle elevation during the initiation (first step) and steady state (second and third steps) are displayed for subject 1 (n = 24 per condition) and subject 2 (n = 25 per condition). (D) The peak occurrences of the ankle elevation and the velocities (x and y) are shown for each subject during the descending phase of the ST (only for the step with the prosthetic leg, n = 24 per condition). All data are shown as box plots for neural sensory feedback (SF) and for without (NF) during OT and ST. P values of the Wilcoxon test are shown. (Photo credit: Giacomo Valle, ETH Zurich).
