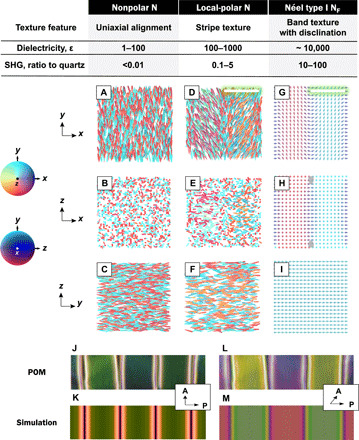
Fig. 4. Model and the free energy of the NF phase.

(A to I) The cross sections of the molecular orientational field of the homogeneous traditional N phase without polarity (A to C) and the locally polarized N phase with the splay texture (D to F) and the most plausible director field for the NF phase (G to I) in the xy, yz, and xz planes. The y and z axes are parallel to the rubbing and surface normal directions. The gray bullet-shaped objects in (H) represent the defect walls near the surfaces. The textural feature, dielectricity, and SHG signal as the ratio to the SH signal of the quartz crystal are shown in the top table. The colors of the rods and arrows correspond to different polar and azimuthal orientational angles as indicated in the color maps in the xy and yz planes. The scale bars for (D) to (F) and (G) and (H) represent the typical length scale for the molecular and the director modulations: The scale bar in (D) to (F) is in the range of 4 to 10 μm; the scale bar in (G) and (H) is in the range of 20 to 70 μm. (J to M) The comparison of the experimental and calculated POM images of the Néel type I NF structure under crossed and decrossed polarizers. The POM observation is made in a 5-μm cell. Image width, 145 μm.
