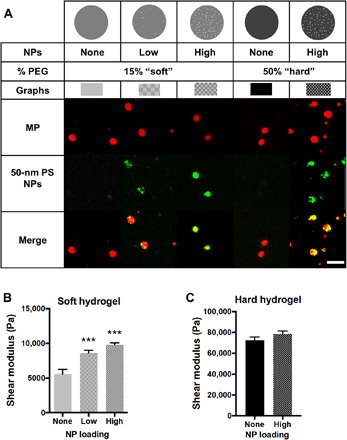
Fig. 1. Material properties of NP-loaded hydrogel MPs.

(A) Schematic and representative confocal microscopy fluorescence images of hydrogel MPs evaluated, having varied modulus and NP loading. Red is MP hydrogel, green is 50-nm PS NPs, and the two are overlaid to show colocalization of NPs and hydrogel MPs. Scale bar, 5 μm. Swollen shear moduli for (B) 15% PEG and (C) 50% PEG hydrogels showing the influence of adding NPs to bulk material rheometry. Statistical analyses were performed using one-way analysis of variance (ANOVA) with Fisher’s least significant difference (LSD) test, where (***) indicates P < 0.001 in comparison to the nonloaded hydrogels. N = 3. Error bars plot SE.
