
Fig. 1. XYZeq enables single-cell and spatial transcriptome profiling simultaneously.
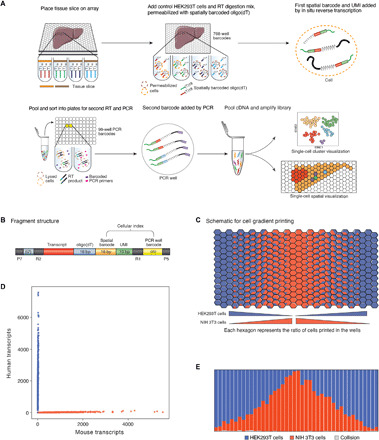
(A) Schematic of the XYZeq workflow. (B) Schematic of XYZeq sequencing library structure. P5 and P7, Illumina adaptors; bp, base pairs; R1 and R2, annealing sites for Illumina sequencing primers. (C) Schematic representation of the mixed-species cell gradient pattern printed on the chip with 11 unique cell proportion ratios (see Methods for specific cell proportion ratios). (D) Scatterplot of mouse (x axis) and human (y axis) UMI counts detected from a mixture of HEK293T and NIH 3T3 cells after computational decontamination. Blue refers to human cells (n = 4182), red refers to mouse cells (n = 2220), and gray refers to collisions (n = 45). (E) Proportion of HEK293T (blue) cells, NIH 3T3 (red) cells, or collisions (gray) detected by XYZeq for each column of the microwell array.