
Fig. 2. Spatially resolved single-cell transcriptomes captured from tissue.
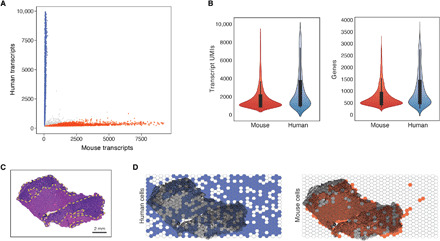
(A) Scatterplot of mouse (x axis) and human (y axis) UMI counts detected from liver/tumor tissues (n = 4) at 500 UMI cutoff after decontamination processing. Blue refers to human cells (n = 2657), red refers to mouse cells (n = 5707), and gray refers to collisions (n = 382). (B) Violin plots showing the number of detected UMIs (left) and genes (right) per mouse (red) and human (blue) cell. Median UMI counts for human cells: 1596; mouse cells: 1009. Median gene counts for human cells: 629; mouse cells: 456 across all liver/tumor slices. (C) H&E-stained image of the liver/tumor tissue slice. Tumor region, dark purple with yellow dotted outlines; liver region, pink. Scale bar, 2 mm. (D) Visualization of human (blue) and mouse (red) cell distribution on the XYZeq array overlayed on the H&E-stained slice.