
Fig. 4. Expression of gene modules in space that track with cellular composition.
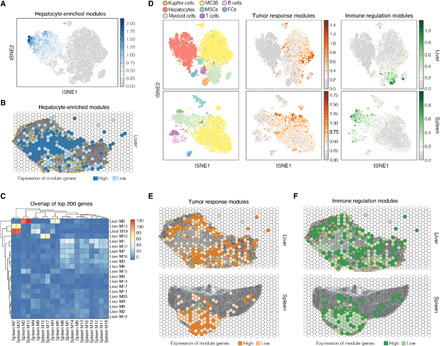
(A) Projection of average expression of hepatocyte-enriched module (LM14) in tSNE space. Each dot is a cell and colored by the average expression of top contributing module genes (Materials and Methods). (B) Spatial expression of hepatocyte-enriched module (LM14). Each spatial well is colored by the average expression of the top contributing module genes weighted by the number of cells per well. Wells are binarized into high (above weighted average) versus low (all other nonzero expression). Yellow dotted outlines indicate tumor regions. (C) Heatmap representing the number of overlapping genes between each pair of modules in liver/tumor and spleen/tumor. Each row is an LM, and each column is an SM. (D) tSNE projection of XYZeq scRNA-seq data colored by annotated cell types in liver/tumor (top left) and spleen/tumor (bottom left) and mean gene expression of the top overlapping modules between liver/tumor (top row) and spleen/tumor (bottom row). Tumor response modules correspond to LM5 and SM12, and immune regulation modules correspond to LM19 and SM7. ECs, endothelial cells. Spatial projection visualizes the mean expression of the tumor response modules (E) corresponding to LM5 and SM12 and the immune regulation modules (F) corresponding to LM19 and SM7. Each well in (E) and (F) is colored by the average gene expression of each module weighted by the number of cells per well (high versus low), and yellow dotted outline indicates tumor regions. Wells are binarized into high (above weighted average) versus low (all other nonzero expression).