
Fig. 5. Differential gene expression within MSCs associated with their spatial proximity to tumor.
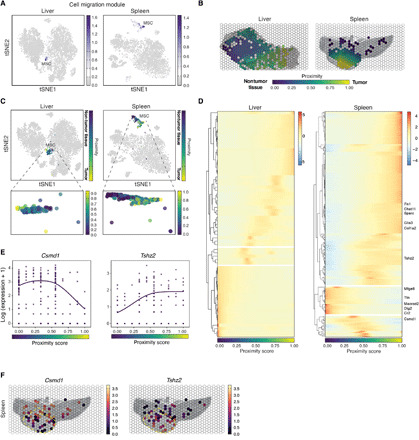
(A) Average expression of the cell migration modules (LM10 and SM17) in tSNE space. Each dot is a cell colored by its mean expression of the top module genes between corresponding liver/tumor and spleen/tumor modules. (B) XYZeq array colored by the tumor proximity score. Values near 1 (yellow) indicate regions rich in tumor, values near 0 (purple) indicate regions rich in nontumor cells, and wells capturing the border between the two tissue types take on values around 0.5 (blue/green). (C) MSCs colored by the cell-specific proximity score in tSNE space. (D) Row-clustered heatmap showing the scaled, mean gene expression in MSCs of genes enriched in three spatial regions (intratumor, boundary, and intratissue) along the one-dimensional proximity score. For spleen/tumor, statistically significant genes enriched in the tumor and nontumor regions are highlighted. (E) Log expression (y axis) of Csmd1 (left) and Tshz2 (right) along the proximity score (x axis). Each dot corresponds to one MSC cell, and the regression line is fitted using the negative binomial distribution (Materials and Methods). (F) Projection in space of mean expression of Csmd1 (left) and Tshz2 (right) in MSCs. Yellow dotted outline indicates tumor region.