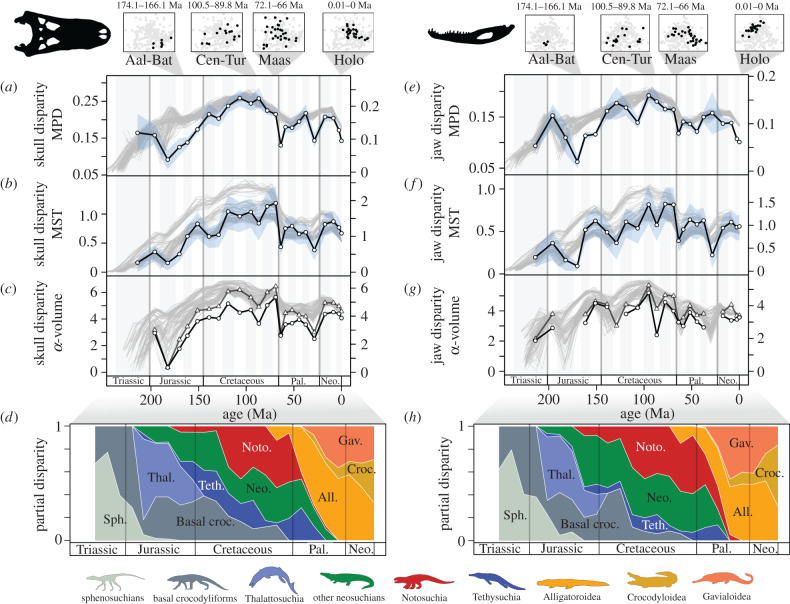
Figure 2.
Temporal patterns of crocodylomorph morphological disparity. Disparity in the skull (a–c) and jaw (e–g) is plotted in 24 time bins (white circle, black line) based on within-bin mean Procrustes/pairwise distances (MPD) (a,e), minimum spanning tree lengths (MST) (b,f), and morphospace alpha-shape volumes (c,g). Blue envelopes in (a), (b), (e) and (f) show 95% confidence intervals after bootstrapping with 1000 iterations. In (c) and (g), the two solid black line curves represent alpha-shape volume disparity for two alpha parameter values, with points in morphospace more tightly enveloped in the lower curves. At the top, the distribution of taxa in skull and jaw morphospace (black circles) is plotted in four time bins (left to right, Aalenian–Bathonian, Cenomanian–Turonian, Maastrichtian and Holocene), illustrating times of low, moderate and high disparity. All time bins are plotted in the supplement (electronic supplementary material, figures S5 and S6). For both the skull and jaw, and for all three disparity metrics, ‘spaghetti plots’ with grey lines in all panels illustrate the results from 100 iterations of phylogenetic time-sliced disparity. Partial skull (d) and jaw (h) disparity of crocodylomorphs from the Late Triassic to Holocene based on time-sliced sampling from a single tree, at 24 approximately 10-million-year time slices (empirical partial disparity plotted in electronic supplementary material, figure S35). (Online version in colour.)

