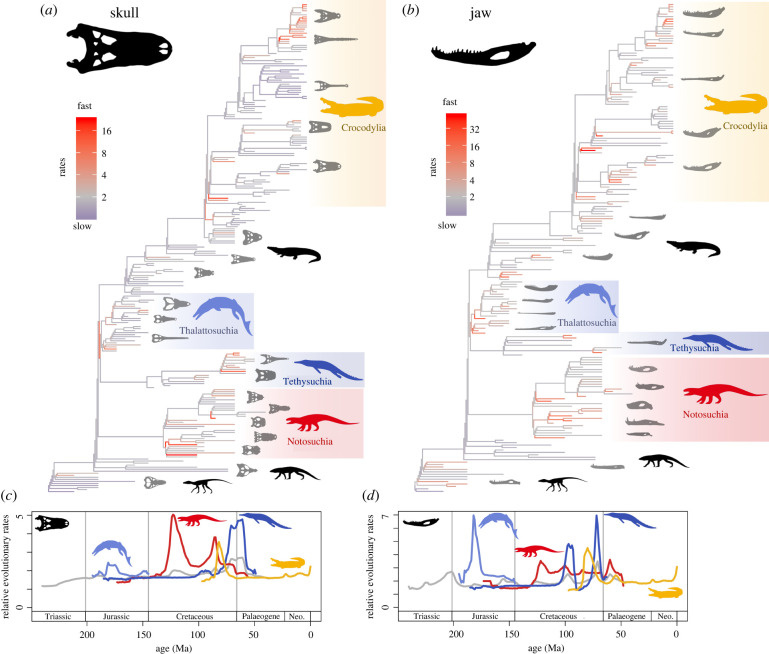
Figure 3.
Rates of crocodylomorph morphological evolution. Rates of (a) skull and (b) jaw shape evolution are plotted on time-calibrated phylogenies, based on the outputs from multivariate variable rates models in BayesTraits. Phylogenetic branches are coloured according to the mean rate scalar parameters, derived from the mean of 100 analytical iterations, grading between slow (blue), intermediate (grey) and fast (red) rates. Groups of focus are highlighted: thalattosuchians (blue), notosuchians (red), tethysuchians (dark blue) and crocodylians (yellow). Phylogenies plotted with all taxa labelled are in the electronic supplementary material, figures S7 and S8. Rates of crocodylomorph (c) skull and (d) jaw shape evolution through time based on 1 Myr time slices are plotted showing major subclades, based on the mean of 100 analytical iterations, showing all crocodylomorphs (grey), thalattosuchians (blue), notosuchians (red), tethysuchians (dark blue) and crocodylians (yellow). Results for individual iterations are illustrated as spaghetti plots in the supplement (electronic supplementary material, figures S9 and S10).

