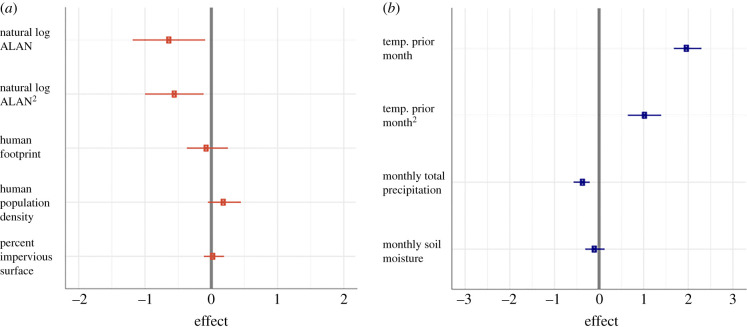
Figure 2.
Effect sizes of (a) ALAN and urbanization and (b) temperature and weather variables on West Nile virus risk. Standardized effect sizes (square symbols) and 95% CI (lines) from top ranked model in table 1. Natural log of ALAN and ALAN2 in radiance (μcd m−2) had the largest effects on WNV risk compared to urbanization parameters, whereas mean temperature and mean temperature2 of the prior month had the largest effect sizes compared to precipitation and soil moisture variables. Variables are natural log transformed to account for the extreme values in the distribution of data. (Online version in colour.)

