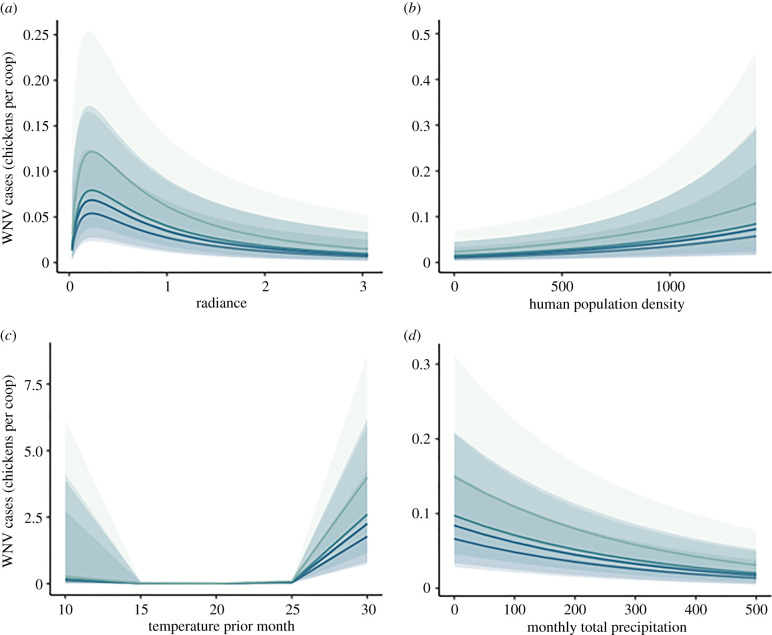
Figure 3.
Inter-annual effects of (a) ALAN, (b) human population density per km2, (c) mean temperature of the previous month in degrees Celsius and (d) monthly total precipitation (mm) on incidence of WNV seroprevalence. Marginal effects of each plotted by year with 95% CI band. Darkest colour denotes earliest year (i.e. 2015) with lighter colours denoting subsequent years. Effects of ALAN (anthropogenic component of night sky brightness in radiance (μcd m−2), human population density, temperature and precipitation on WNV exposure were consistent across 5 years. (Online version in colour.)

