. 2021 Mar 8;10:e51675. doi: 10.7554/eLife.51675

Figure 2. Neuropil subtraction optimized for 1 AP (action potential) detection.

(A) Effect of changing neuropil subtraction on detection for exemplar GCaMP6s and GCaMP6f neurons. Upper plots: family of receiver operating characteristic (ROC) curves. Each curve illustrates detection probability for true APs against probability of false positives as detection threshold is changed, for 1 AP events. False positives were calculated from time windows with no APs. Each ROC curve represents a different value of r. Lower plots: area under the ROC curve as a function of r. Gray symbols represent value of r for which r * Fneuropil(t) was greater than Fcell_measured(t), resulting in a negative F0 and inversion of the ΔF/F trace. (B) Distribution of r values for 20 GCaMP6f neurons.

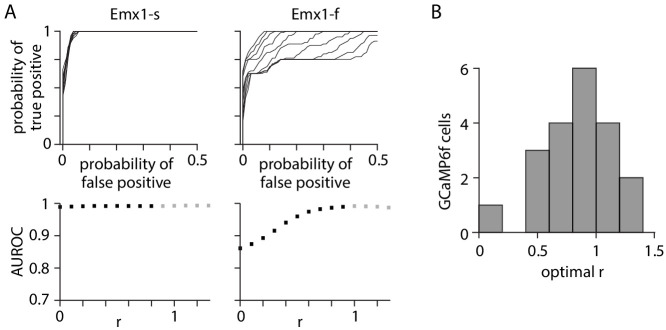
Figure 2.

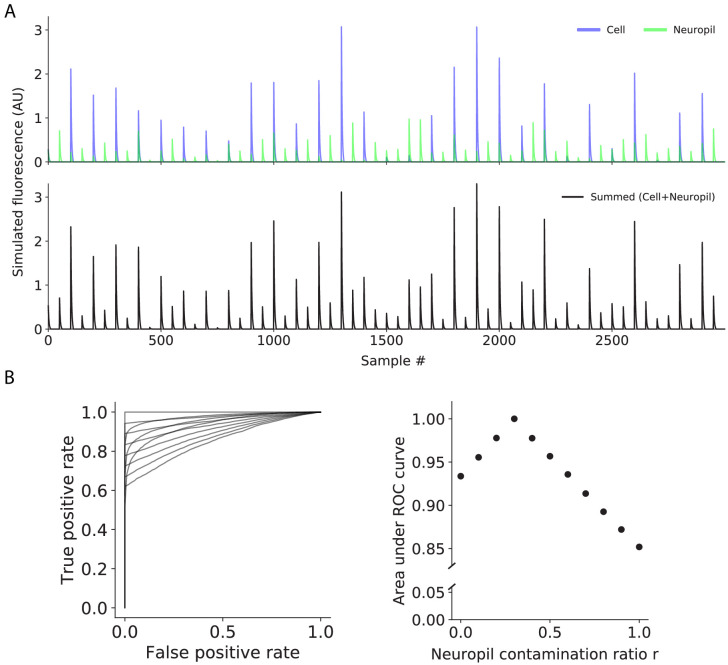
Figure 2—figure supplement 1. Simulated effect of neuropil subtraction on event detection.

Figure 2—figure supplement 1.

(A) Simulated cell and neuropil traces. The neuropil trace contained transients that were (1) associated with cell transients and (2) between cell transients, and amplitudes were scaled by the neuropil contamination ratio r (r = 0.3) relative to the cell amplitudes. (B) (Left) Receiver operating characteristic (ROC) curves for classifying cell amplitudes, where r was varied from 0 to 1 for neuropil correction. The detection threshold was defined as the xth percentile of noise amplitudes (amplitudes of the neuropil trace that were between cell transients), where 1–x represented the false positive probability, and the detection probability (true positive probability) was the fraction of estimated cell amplitudes (amplitudes of the summed trace that were associated with cell transients) above the detection threshold. (Right) Area under ROC curves as a function of r.