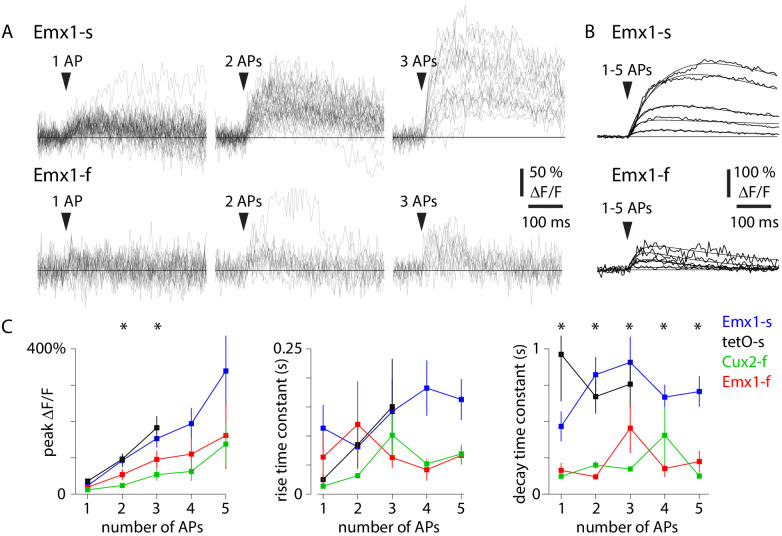
Figure 3. Action potential (AP)-evoked calcium transients in four mouse lines.
(A) Example fluorescence traces (ΔF/F, with r = 0.82 neuropil subtraction) for 1 AP, 2 AP, and 3 AP events for an exemplar Emx1-s neuron (forty-two 1 AP events, thirty-eight 2 AP events, sixteen 3 AP events) and an exemplar Emx1-f neuron (twenty-three 1 AP events, twelve 2 AP events, eleven 3 AP events). (B) Mean fluorescence traces and fits (sum of two exponentials) for 1–5 AP events for the two neurons in A. (C) Mean ± SEM peak DF/F, rise time constant, and decay time constant for four mouse lines. Number of neurons for 1–5 AP events were: 15, 16, 14, 9, 6 for Emx1-s; 4, 4, 4, 0, 0 for tetO-s; 10, 10, 10, 5, 4 for Emx1-f; 9, 9, 7, 4, 2 for Cux2-f. Asterisks indicate differences between mouse lines (p<0.05, one-way ANOVA).
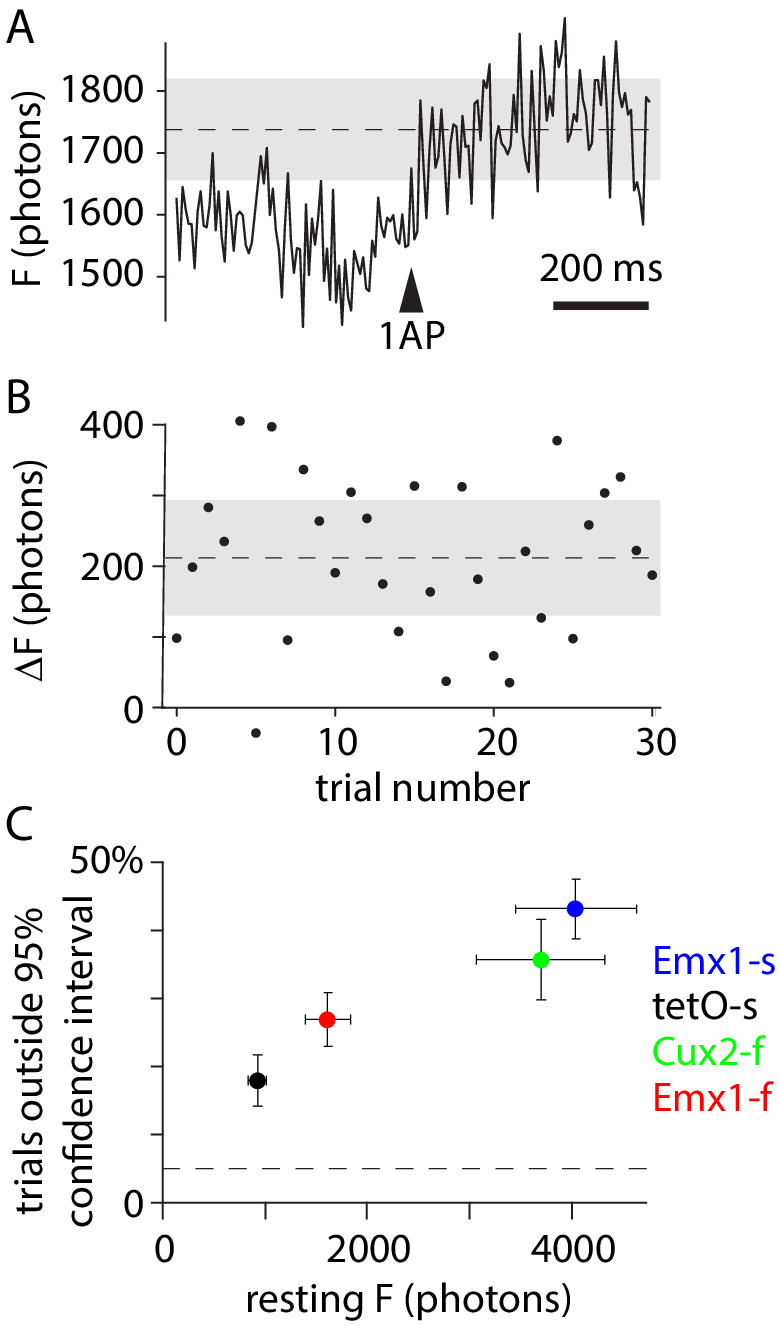
Figure 3—figure supplement 1. Trial-to-trial variability of 1 AP (action potential) events.


