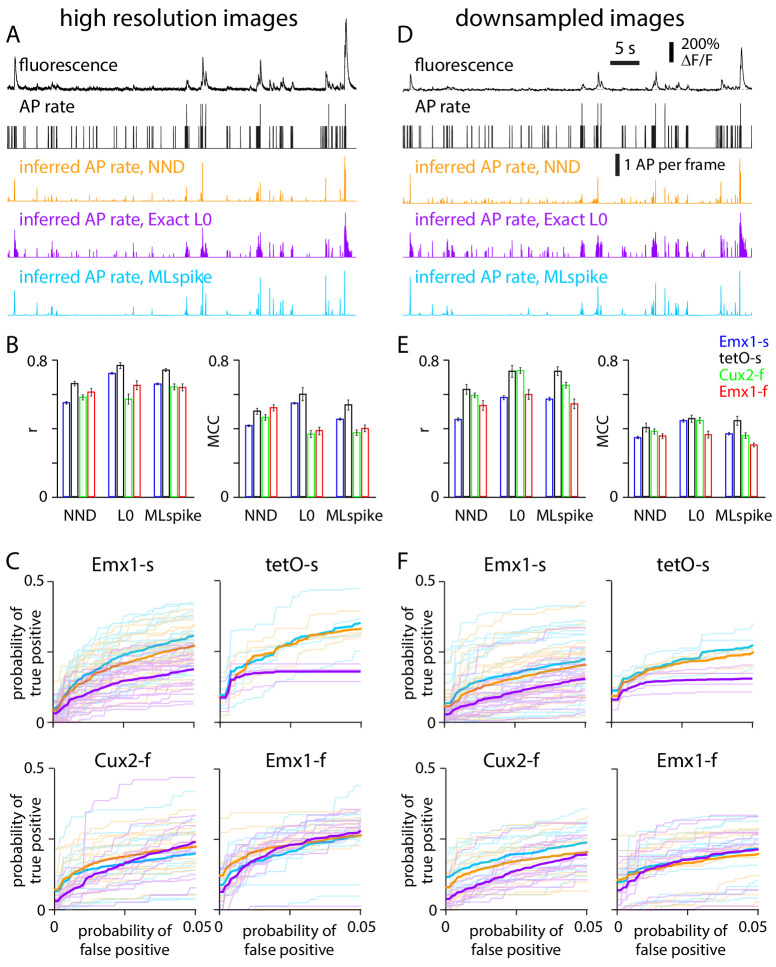
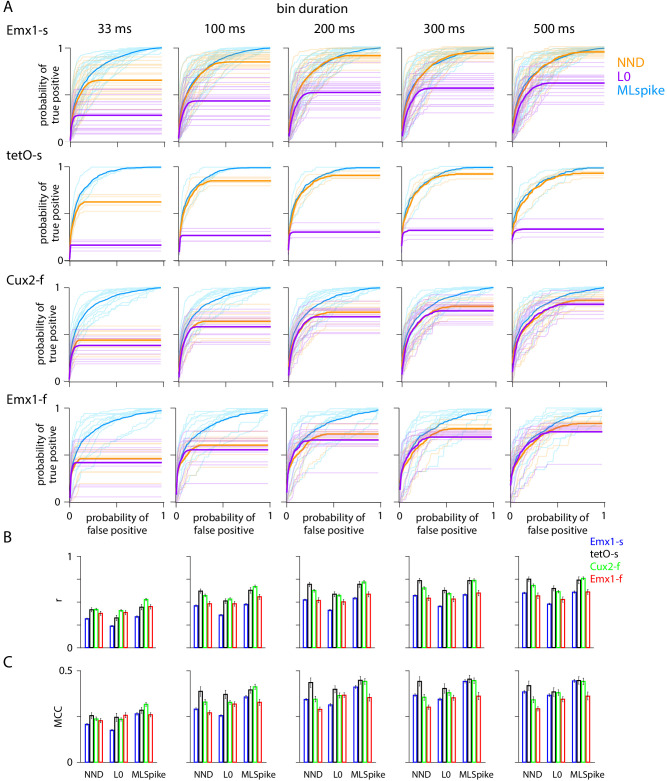
Figure 6. Performance of spike inference algorithms on high-resolution and downsampled images.
(A) Results from an exemplar Cux2-f neuron, at high resolution. Fluorescence and action potential (AP) rate from electrophysiology (black). Below, APs per image frame estimated with three spike inference algorithms: MLspike (blue), Exact L0 (purple), and non-negative deconvolution (NND, orange). (B) Pearson correlation coefficient (r) and Matthews correlation coefficient (MCC) for the three algorithms for each mouse line. 300 ms bins. (C) Receiver operating characteristic (ROC) curves, reporting probabilities of detecting true and false events in each time bin. Thin lines: individual neurons. Thick lines: mean across neurons. 300 ms bins. (D–F) Equivalent plots for downsampled images.


