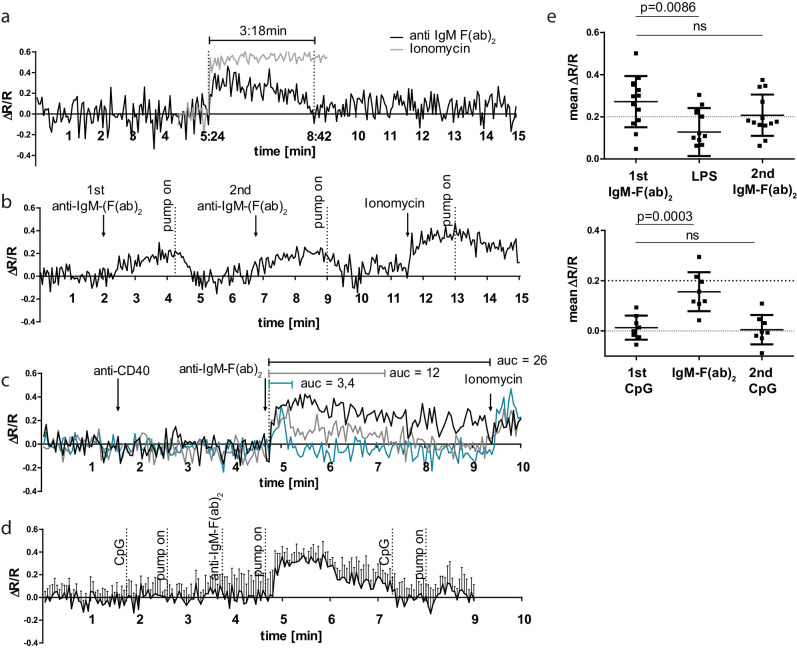
Figure 2. B cell receptor (BCR) stimulation specifically leads to calcium mobilization in YellowCaB cells in vitro.
(a) Confocal measurement of Förster resonance energy transfer (FRET) duration (ΔR/R > 0) in non-perfused primary polyclonal YellowCaB cells after addition of 10 µg/ml anti-IgM-F(ab)2 (black) and ionomycin control (gray). Data representative for at least 35 single cells in four independent experiments. (b) Confocal measurement of FRET signal change after repeated addition of anti-IgM-F(ab)2 to perfused primary polyclonal YellowCaB cells. Data representative for at least 50 cells out of five independent experiments. (c) Confocal measurement of FRET signal change after addition of anti-IgM-F(ab)2 to perfused primary polyclonal YellowCaB cells following stimulation with anti-CD40 antibody and ionomycin as positive control. Examples of transient cytoplasmic (blue), intermediate (gray), and sustained calcium mobilization shown, area under the curve compared. Data representative for 26 cells out of two independent experiments. (d) Resulting FRET curve out for n = 7 primary polyclonal YellowCaB cells perfused with toll-like receptor (TLR)9 stimulator cytosine phosphate guanine (CpG) in Ringer solution and subsequent addition of anti-IgM-F(ab)2. (e) Mean FRET signal change over time after addition of TLR4 or TLR9 stimulation in combination with BCR crosslinking by anti-IgM-F(ab)2 in perfused polyclonal YellowCaB cells. n = 12 (top) and n = 8 (bottom), one-way ANOVA. Error bars: SD/mean.


