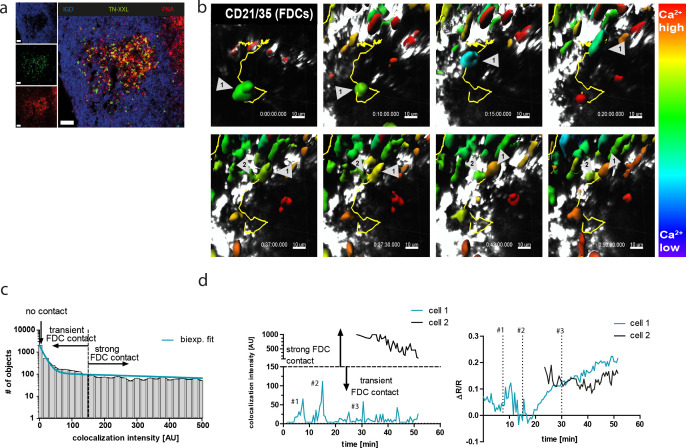
Figure 3. YellowCaB cells form productive germinal centers in vivo and show active B cell receptor signaling after cell-to-cell contacts.
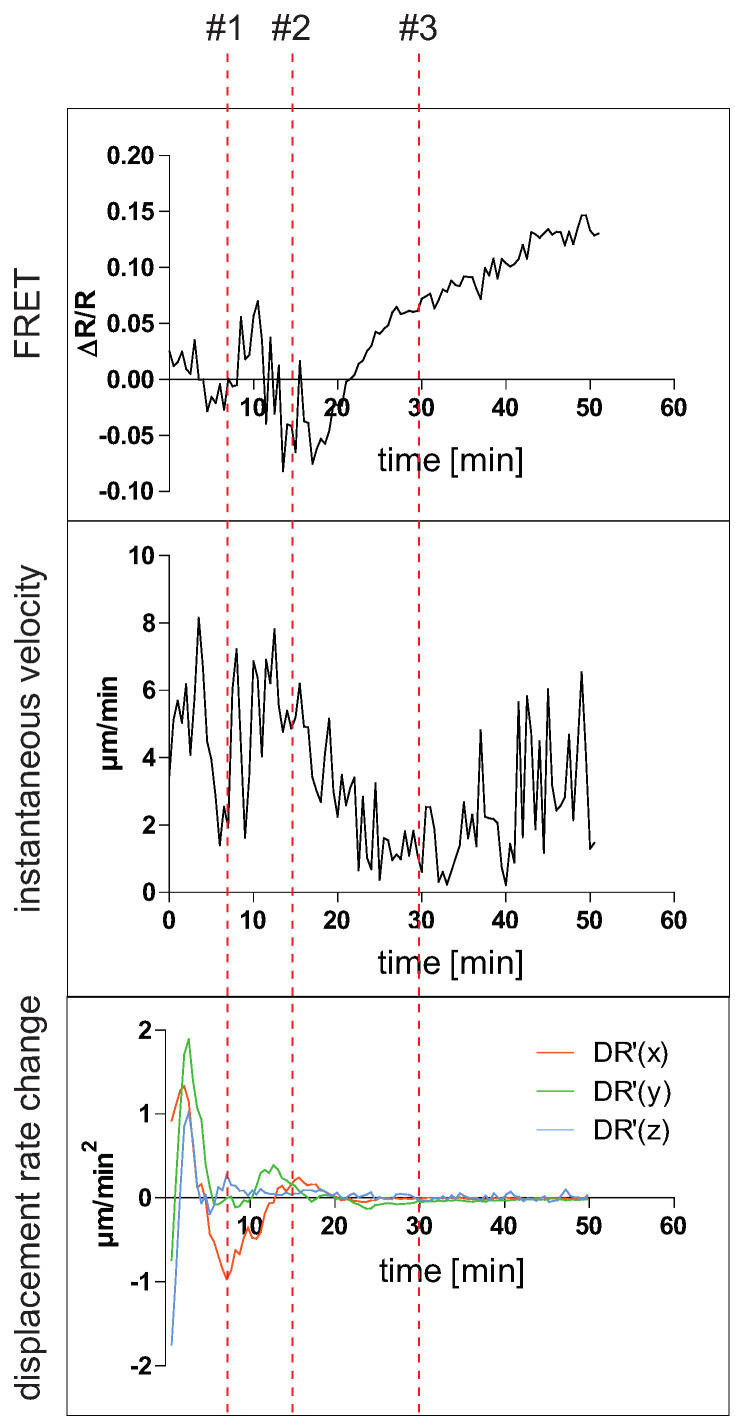
(a) Histological analysis of host mouse lymph nodes after adoptive transfer of YellowCaB cells. TN-XXL (green)-positive cells cluster in IgD (blue)-negative regions; a germinal center phenotype is confirmed by PNA staining (red). Scale bar 50 µm. (b) Stills of ratiometric intravital imaging of adoptively transferred YellowCaB cells. 3D surface rendering and single-cell tracking (track line in yellow) with relative color coding ranging from blue = low ΔR/R to red = high ΔR/R (c) Histogram showing segmented objects binned due to colocalization intensity within bin width of 20 AU and biexponential fit of data. Total number of objects = 6869. A curve decay of <10% was set as threshold, parting transient from strong B cell–FDC contact. All cells with colocalization intensity <1 were assigned negative. (d) Colocalization intensities of tracked cells 1 and 2 over time versus Förster resonance energy transfer signal change of cells 1 and 2 over time. Contact events to FDCs were assigned numbers #1, #2, and #3.


