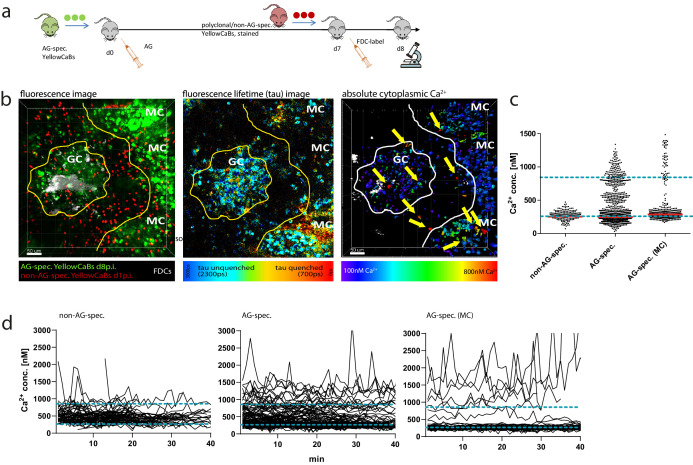
Figure 5. Determination of absolute calcium concentration by intravital fluorescence lifetime imaging of germinal center (GC) B cell populations.
(a) Cell transfer and immunization strategy for intravital imaging of antigen (AG)-specific and polyclonal YellowCaB cells. (b) Left: maximum intensity projection of a z-stack, intravitally imaged GC, and medullary cords (MCs). B cells were distinguished as polyclonal, non-AG-specific YellowCaB cells (red), AG-specific YellowCaB cells, and AG-specific cells inside the MC. Middle: color-coded fluorescence lifetime image with lifetimes of unquenched eCFP depicted in blue and lifetimes of quenched eCFP in red. Right: 3D-rendered, color-coded z-stack showing absolute calcium concentrations in GC and MC. Yellow arrows point to cells containing high cytoplasmic calcium. (c) Bulk analysis of absolute calcium concentrations in segmented single-cell objects from B cell subsets at any given time point measured. The dynamic range of the genetically encoded calcium indicator (GECI) TN-XXL is indicated by blue dashed lines. (d) Time-resolved analysis of calcium concentrations in tracked segmented objects corresponding to B cell subsets in (c). 2 frames per minute. Non-AG-specific YellowCaB cells (left, n = 92 tracks); AG-specific YellowCaB cells (middle, n = 169 tracks); and extrafollicular AG-specific YellowCaB cells in MC (right, n = 69 tracks). The dynamic range of the GECI TN-XXL is indicated by blue dashed lines.
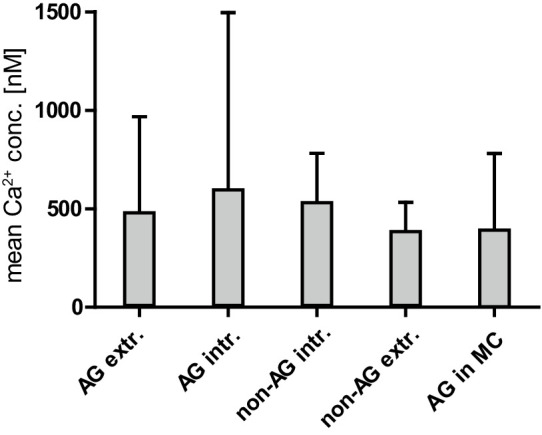
Figure 5—figure supplement 1. Mean calcium concentration and SD in non-antigen (AG)-specific and AG-specific YellowCaB cells distinguished by localization.


