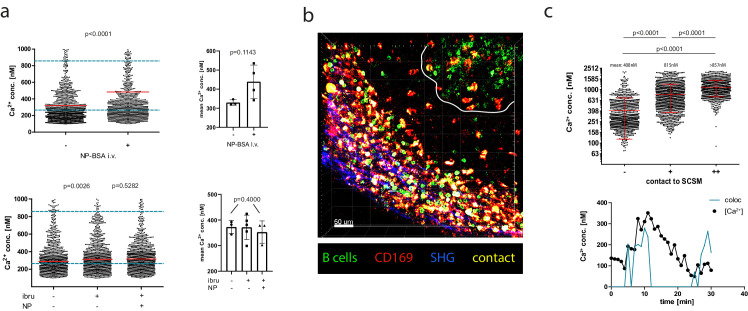
Figure 6. Antigen dependency of calcium elevation in germinal center (GC) and extrafollicular B cells.
(a) Top panel: absolute calcium concentrations measured in antigen (AG)-specific GC B cells before and after in vivo injection of NP-BSA. Exemplary results (left) and pooled data from three imaged mice (right). Bottom panel: absolute calcium concentrations measured in AG-specific GC B cells before and after in vivo injection of the Bruton’s tyrosine kinaseinhibitor ibrutinib, followed by injection of NP-BSA. Exemplary results (left) and pooled data from three imaged mice (right). (b) z-stack of intravitally imaged lymph node with GC (white line) and subcapsular sinus (indicated by SHG, blue). CD169+ macrophages (red, contacts [yellow], YellowCaB cells [green]). Size 500 × 500 × 78 µm. Scale bar 60 µm. (c) Top: Fluorescence lifetime imaging measurement of mean absolute calcium concentration of YellowCaB cells showing no (–), transient (+), or strong (++) overlap with CD169+ signal. n = 1000, ANOVA analysis, mean and SD. Bottom: Single-cell track of a YellowCaB cell making transient contact to a macrophage; blue: colocalization intensity (AU); black: change of absolute calcium concentration.
Figure 6—figure supplement 1. Calcium concentration change detected by in vivo fluorescence lifetime imaging measurements over time, exemplary single germinal center (GC) B cell tracks, before and after injection(s) of compounds.

Figure 6—figure supplement 2. Absolute calcium concentration of fluorescence lifetime imaging measured after NP-BSA stimulation of ex vivo lipopolysaccharide-induced plasmablasts.

Figure 6—figure supplement 3. Colocalization histogram and exponential fit for analysis of colocalization between CD169+ macrophages and extrafollicular YellowCaB cells.


