. 2021 Apr 9;10:e61880. doi: 10.7554/eLife.61880

Figure 1. NusG is an intrinsic termination factor that works with NusA to stimulate suboptimal terminators.

(A) Violin plots overlayed with box plots showing the distribution of termination efficiency (%T) in wild-type (WT), nusAdep, ΔnusG, and nusAdep ΔnusG strains. For this and all box plots, boundaries of the box designate the interquartile range (IQR), while upper/lower whiskers extend from the 75th/25th percentile to the largest/smallest value no further than 1.5*IQR in either direction. All pairwise p-values can be obtained from Supplementary file 3. (B) Venn diagram showing the number and overlap of terminators that were classified as being dependent (Δ%T ≥ 25) on NusA (Req A) and/or NusG (Req G). The black circle contains all terminators that were classified as dependent in the nusAdep ΔnusG strain, the magenta circle contains all terminators that were classified as dependent in the nusAdep strain, and the cyan circle contains all terminators that were classified as dependent in the ΔnusG strain. Intrinsic terminator subpopulations that require NusA and/or NusG in any fashion to terminate efficiently are specified. (C) Violin plots overlayed with box plots showing the distribution of predicted hairpin strength as reported in ΔG (kcal/mol) for all identified subpopulations including the strong and independent (SI) terminators. All pairwise p-values can be obtained from Supplementary file 3. (D) Sequence logos of the U-rich tracts generated from the nine nucleotide (nt) window downstream of the predicted hairpins for all identified subpopulations including the SI terminators. All pairwise comparisons can be found in Supplementary file 3.

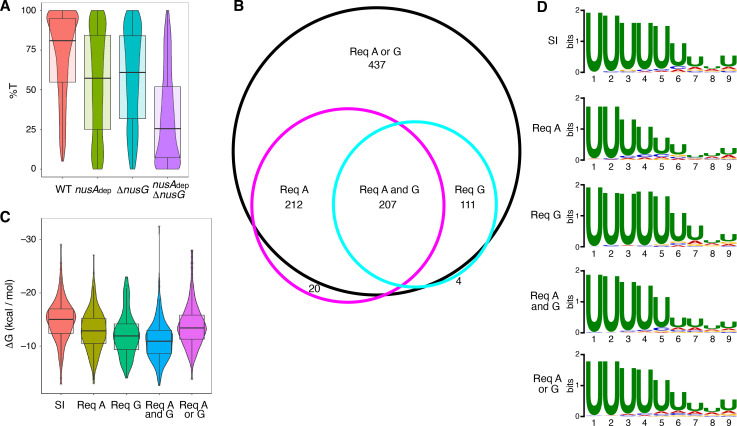
Figure 1.

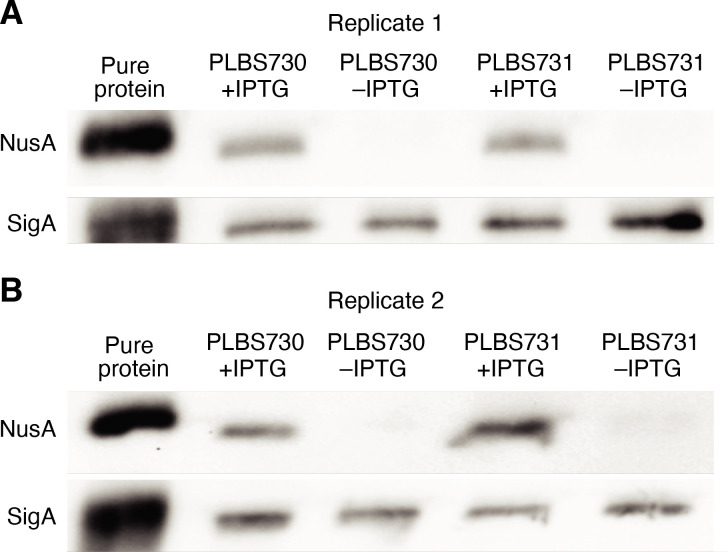
Figure 1—figure supplement 1. Western blot analysis of NusA depletion.

Figure 1—figure supplement 1.

(A) Western blot for all samples used for Term-seq replicate 1. Top panel, image after probing for NusA. Bottom panel, image after probing for SigA as a loading control. Purified NusA and SigA are in the left lane. Lanes containing protein extracted from strains PLBS730 ± IPTG and PLBS731 ± IPTG are specified. (B) Identical to panel (A) except samples from replicate 2.
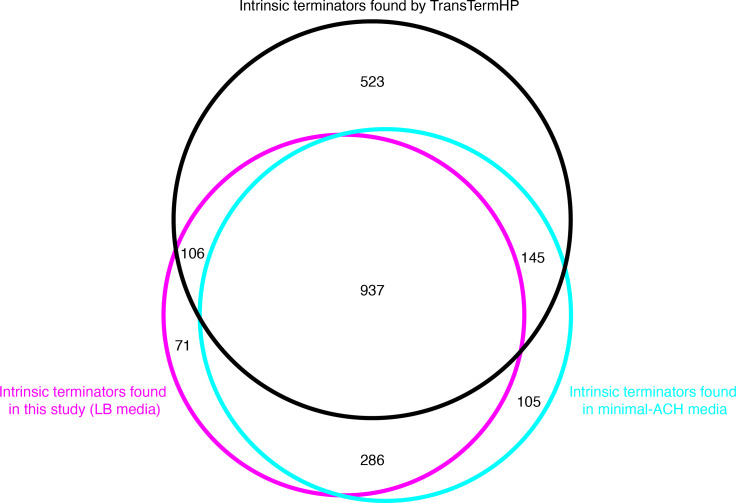
Figure 1—figure supplement 2. Benchmarking the intrinsic terminators identified in this study.

Figure 1—figure supplement 2.

Venn diagram showing the number and overlap of Bacillus subtilis terminators identified within three distinct datasets. The black circle contains all terminators that were identified by the in silico tool TransTermHP, the magenta circle contains all terminators that were identified here via Term-seq conducted in wild-type (WT) B. subtilis grown in LB media, and the cyan circle contains all terminators that were identified previously via Term-seq conducted in WT B. subtilis grown in Minimal-ACH media (Mondal et al., 2016).
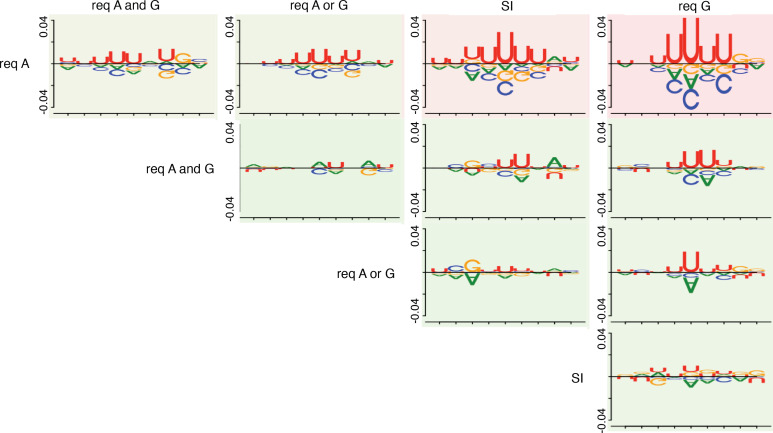
Figure 1—figure supplement 3. Pairwise comparative analysis of U-rich tract sequence logos.

Figure 1—figure supplement 3.

The DiffLogo (Nettling et al., 2015) toolkit was used to determine the per-nucleotide Jensen-Shannon divergences for each U-rich tract sequence logo that was generated for the strong and independent (SI), requiring NusA (Req A), requiring NusG (Req G), Req A and G, and Req A or G terminator subpopulations in a pairwise fashion. For each pairwise comparison, the sequence above the line represents the nucleotide enrichments of each position within the U-rich tract sequence logo generated for the terminator subpopulation specified above the comparison, compared to the U-rich tract sequence logo generated for the terminator subpopulation specified to the side of the comparison. Likewise, the sequence below the line represents the nucleotide enrichments for each position within the U-rich tract sequence logo generated for the terminator subpopulation specified to the side of the comparison, compared to the U-rich tract sequence logo generated for the terminator subpopulation specified above the comparison. The y axes display the precise divergence values. More similar sequence logos rank as more green, while more divergent logos rank as more red.
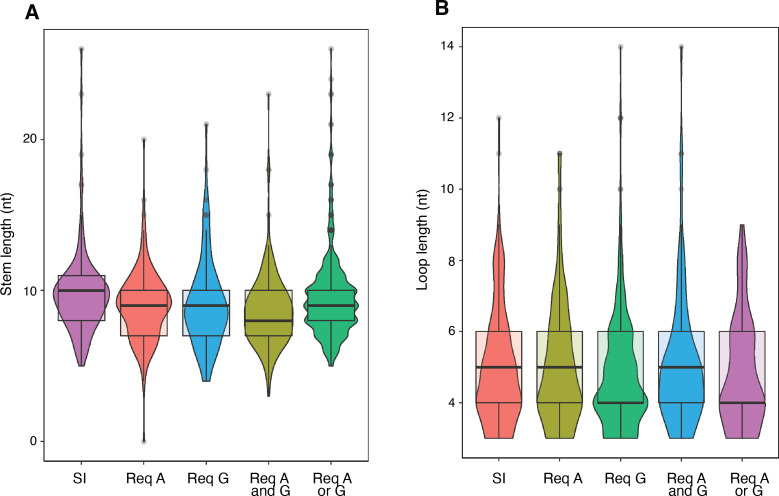
Figure 1—figure supplement 4. Intrinsic terminator hairpin stem length and loop length.

Figure 1—figure supplement 4.

(A) Violin plots overlayed with box plots showing the distribution of terminator hairpin stem lengths of the strong and independent (SI), requiring NusA (Req A), requiring NusG (Req G), Req A and G, and Req A or G terminator subpopulations identified in Figure 1B. (B) Violin plots overlayed with box plots showing the distribution of terminator hairpin loop lengths of the SI, Req A, Req G, Req A and G, and Req A or G terminator subpopulations identified in Figure 1B.
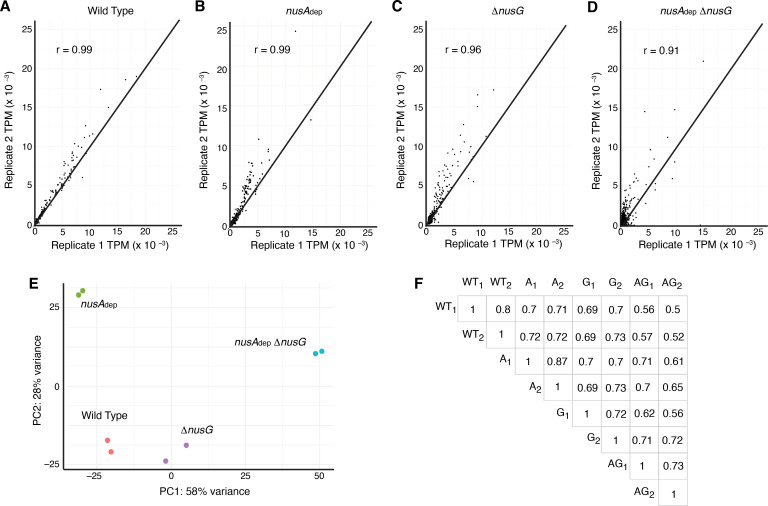
Figure 1—figure supplement 5. Transcriptomics data showing that Term-seq replicates are highly correlated and data from each strain is distinct.

Figure 1—figure supplement 5.

(A) Scatter plot of all protein coding sequence transcripts per million (TPM) values calculated from the wild-type (WT) strain replicates. Line is through the diagonal (y = x) and Spearman’s correlation value specified in the plot. (B) Identical to panel (A) except for nusAdep strain replicates. (C) Identical to panel (A) except for ΔnusG strain replicates. (D) Identical to panel (A) except for nusAdep ΔnusG strain replicates. (E) Principal component analysis (PCA) plot of transcriptomics data collected from each sample. (F) A correlational matrix plot displaying the pairwise Spearman’s correlational r-values obtained when comparing all intrinsic terminator %T values between replicates.