. 2021 Apr 9;10:e61880. doi: 10.7554/eLife.61880

Figure 4. NusG stimulates terminators with particularly weak terminal base pairings.

(A) YetJ terminator showing the point of termination identified in vivo by Term-seq (POTTerm-seq) and by in vitro transcription in the +A+G condition (POTin vitro). Disruptions in the U-rich tract are shown in red. The upstream A tract is also shown. An IGV screenshot of this terminator is shown in Figure 2A. (B) Single-round in vitro termination assay with the yetJ terminator. Experiments were performed in the absence (–) or presence of NusA (A) and/or NusG (G) as indicated. Positions of terminated (POT) and run-off (RO) transcripts are marked. RNA sequencing lanes (A, U, C, G) are labeled. (C) IGV screenshot of a genomic window centered around the fur terminator. Top track is the 3’ end identified by Term-seq. Bottom tracks are the RNA-seq coverage data for the nusAdep ΔnusG (-), ΔnusG (+NusA), nusAdep (+NusG), and WT (+NusA +NusG) strains. %T in each strain is shown on the right of each track. Transcription proceeds from right to left. (D, E) Identical to panels (A, B) except that it is the fur terminator. (D) Note that the terminal three base pairs contain the A tract and one G residue.

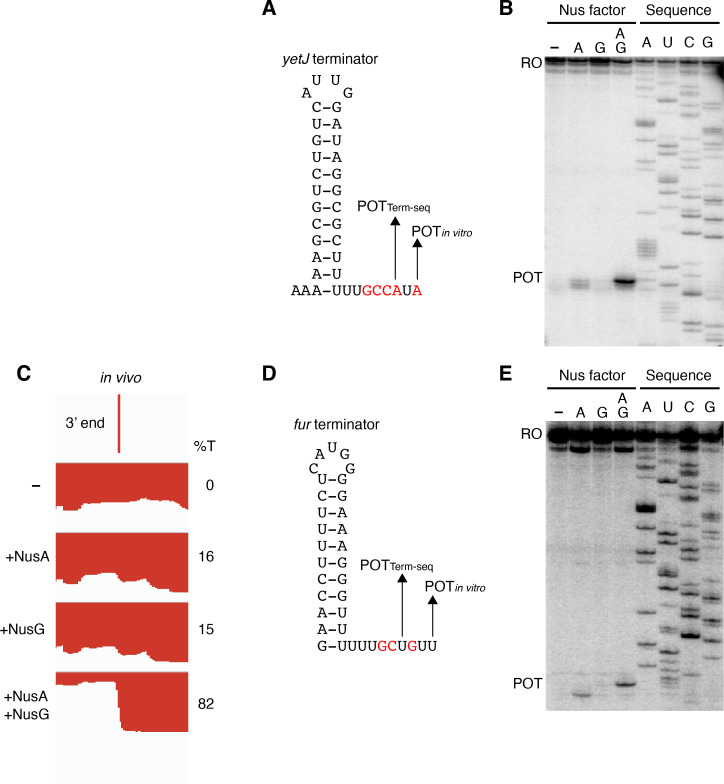
Figure 4.

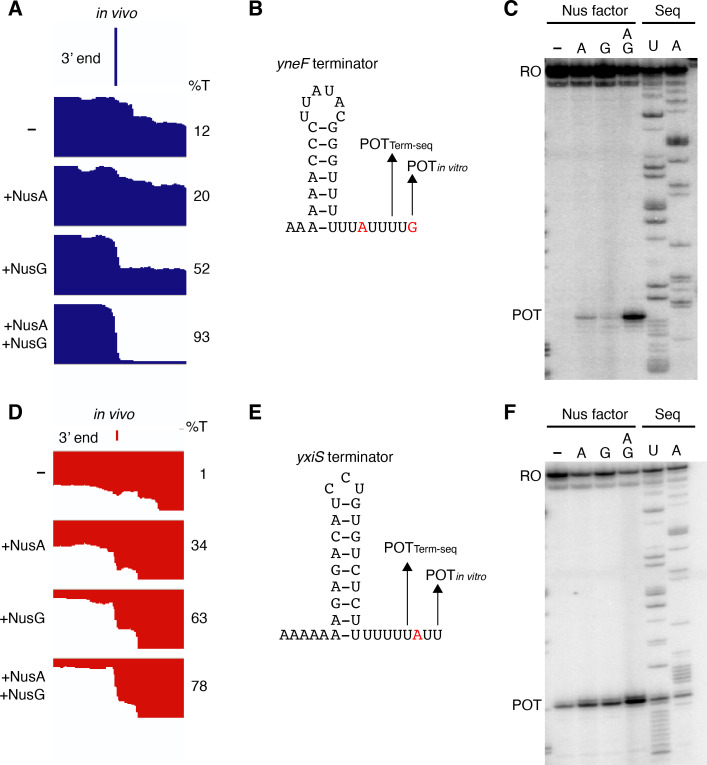
Figure 4—figure supplement 1. NusG stimulates termination at terminators containing A-U base pairs at the base of the hairpin.

Figure 4—figure supplement 1.

(A) IGV screenshot of a genomic window centered around the yneF terminator. Top track is the 3’ end identified by Term-seq. Bottom tracks are the RNA-seq coverage data for the nusAdep ΔnusG (-), ΔnusG (+NusA), nusAdep (+NusG), and wild-type (WT) (+NusA +NusG) strains. %T in each strain is shown on the right of each track. Transcription proceeds from left to right. (B) YneF terminator showing the point of termination identified in vivo by Term-seq (POTTerm-seq) and by in vitro transcription in the +A+G condition (POTin vitro). Disruptions in the U-rich tract are shown in red. The upstream A tract is also shown. (C) Single-round in vitro termination assay with the yneF terminator. Experiments were performed in the absence (–) or presence of NusA (A) and/or NusG (G) as indicated. Positions of terminated (POT) and run-off (RO) transcripts are marked. RNA sequencing lanes (U, A) are labeled. (D–F) Identical to panels (A–C) except that it is for the yxiS terminator. (D) Transcription is from right to left.
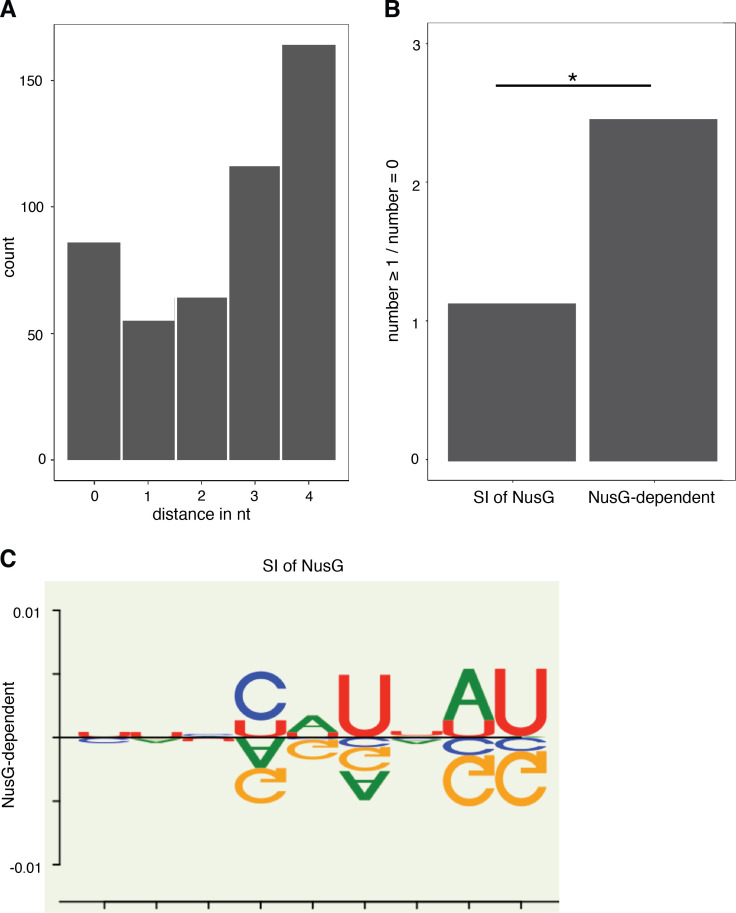
Figure 4—figure supplement 2. RNET-seq analysis of intrinsic termination.

Figure 4—figure supplement 2.

(A) Histogram showing the number of intrinsic terminators at which an RNET-seq 3’ end was identified 0, 1, 2, 3, or 4 nucleotide (nt) downstream from the 3’ end identified by Term-seq. (B) Histogram showing the number of intrinsic terminators with ≥1 consecutive terminal A-U/G-U base pair (bp) divided by the number of intrinsic terminators with 0 consecutive terminal A-U/G-U bp for intrinsic terminators classified as strong and independent of NusG (SI of NusG) and terminators classified as NusG-dependent. Statistical p-value obtained from Fisher’s exact test displayed above the horizontal bar. (C) The DiffLogo (Nettling et al., 2015) toolkit was used to determine the per-nucleotide Jensen-Shannon divergences for the revised U-rich tract sequence logos that were generated for the SI of NusG and NusG-dependent terminator subpopulations. The sequence above the line represents the nucleotide enrichments of each position within the U-rich tract sequence logo generated for the SI of NusG terminator subpopulation, compared to the U-rich tract sequence logo generated for the NusG-dependent terminator subpopulation. Likewise, the sequence below the line represents the nucleotide enrichments for each position within the U-rich tract sequence logo generated for the NusG-dependent terminator subpopulation, compared to the U-rich tract sequence logo generated for SI of NusG terminator subpopulation. The y axes display the precise divergence values.
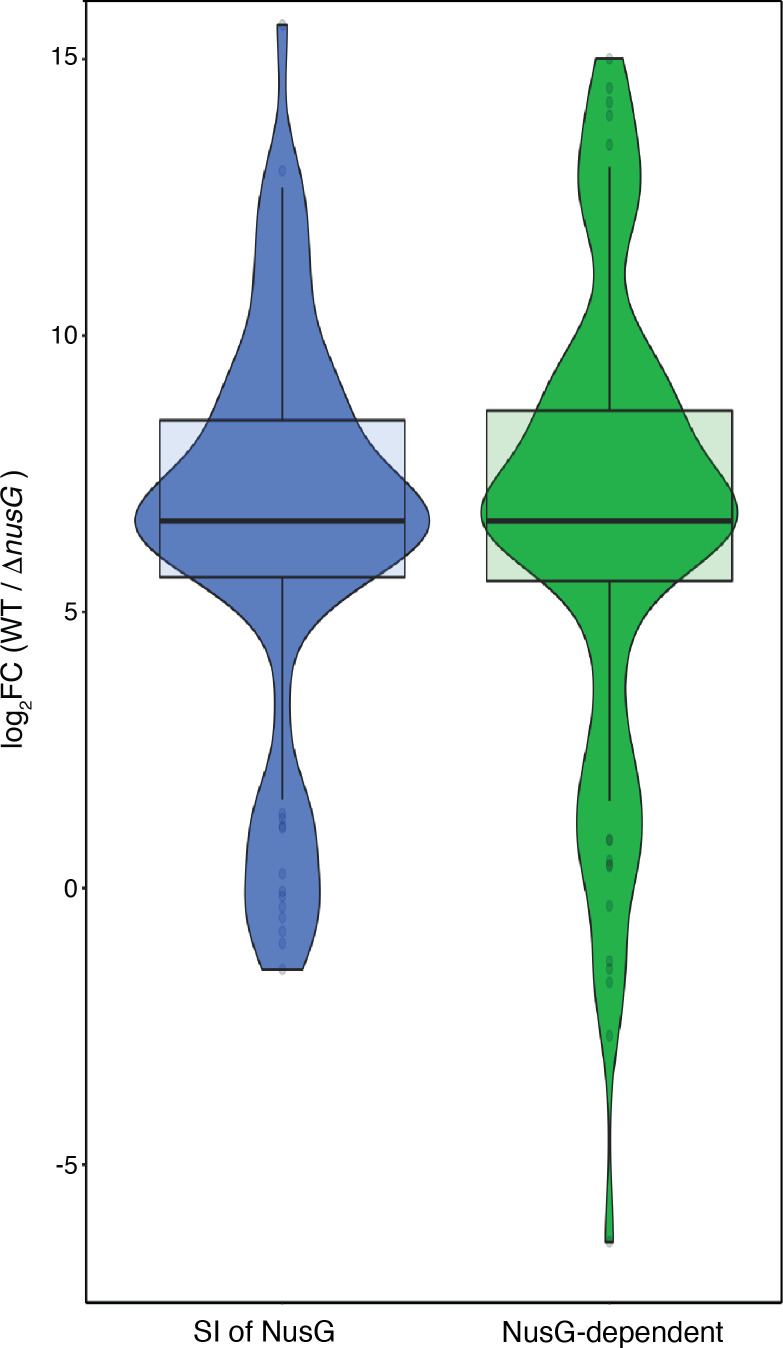
Figure 4—figure supplement 3. RNET-seq analysis of NusG-dependent pausing at intrinsic terminators.

Figure 4—figure supplement 3.

Violin plots overlayed with a box plot showing the NusG dependency of RNET-seq 3’ ends found at intrinsic terminators as calculated by the log2 transformed ratio of the normalized 3’ end abundance in the wild-type (WT) strain to the normalized 3’ end abundance in the ΔnusG strain.
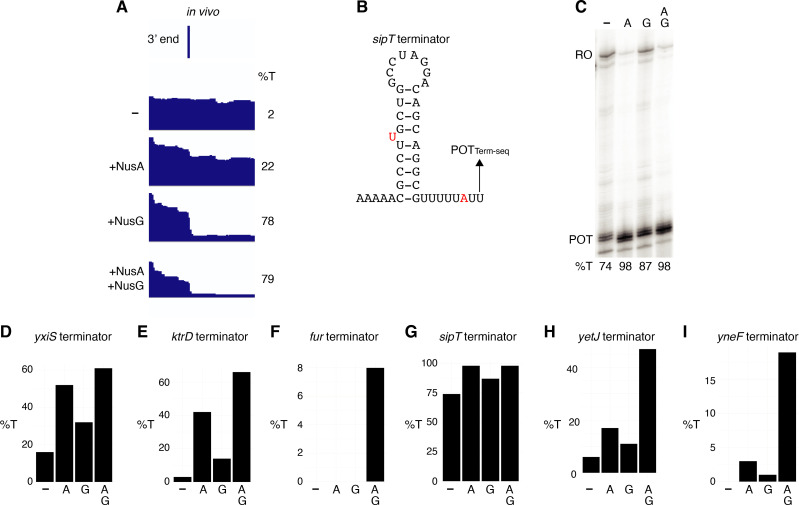
Figure 4—figure supplement 4. NusA is a more potent termination factor in vitro than NusG.

Figure 4—figure supplement 4.

(A) IGV screenshot of a genomic window centered around the sipT terminator. Top track is the 3’ end identified by Term-seq. Bottom tracks are the RNA-seq coverage data for the nusAdep ΔnusG (-), ΔnusG (+NusA), nusAdep (+NusG), and wild-type (WT) (+NusA +NusG) strains. %T in each strain is shown on the right of each track. Transcription proceeds from left to right. (B) SipT terminator showing the point of termination identified in vivo by Term-seq (POTTerm-seq). Disruptions in the hairpin and U-rich tract are shown in red. The upstream A tract is also shown. (C) Single-round in vitro termination assay with the sipT terminator. Experiments were performed in the absence (–) or presence of NusA (A) and/or NusG (G) as indicated. Positions of terminated (POT) and run-off (RO) transcripts are marked. %T is shown below each lane. (D–I) In vitro termination efficiencies for the specified terminators in the absence (–) or presence of NusA (A) and/or NusG (G) as indicated.
Figure 4—figure supplement 5. Convergent transcription does not modify the impact of NusG in vitro.

Figure 4—figure supplement 5.

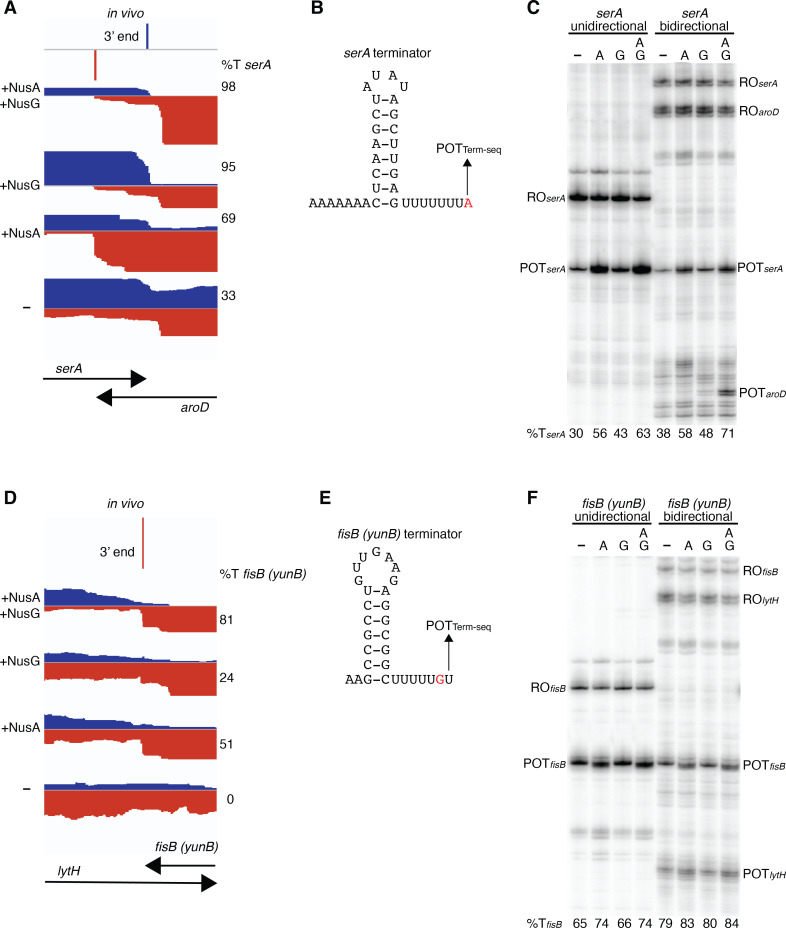
(A) IGV screenshot of a genomic window showing the intersection of serA and aroD. Top track is the 3’ end of serA identified by Term-seq. Bottom tracks are the RNA-seq coverage data for the wild-type (WT) (+NusA +NusG), nusAdep (+NusG), ΔnusG (+NusA), and nusAdep ΔnusG (–) strains. %T in each strain is shown on the right of each track. Transcription proceeds from left to right for serA (blue) and right to left for aroD (red). (B) SerA terminator showing the point of termination identified in vivo by Term-seq (POTTerm-seq). The upstream A tract is also shown. (C) In vitro transcription of the serA terminator (serA unidirectional) or both the serA and aroD terminators (serA bidirectional). Experiments were performed in the absence (–) or presence of NusA (A) and/or NusG (G) as indicated. Positions of terminated (POT) and run-off (RO) products are marked. %T is shown below each lane. (D–F) Identical to panels (A–C) except that it is the fisB (yunB) terminator at the fisB-lytH intersection.
Figure 4—figure supplement 6. Comparison of Term-seq 3’ ends, RNET-seq 3’ ends, and in vitro 3’ ends.

Figure 4—figure supplement 6.

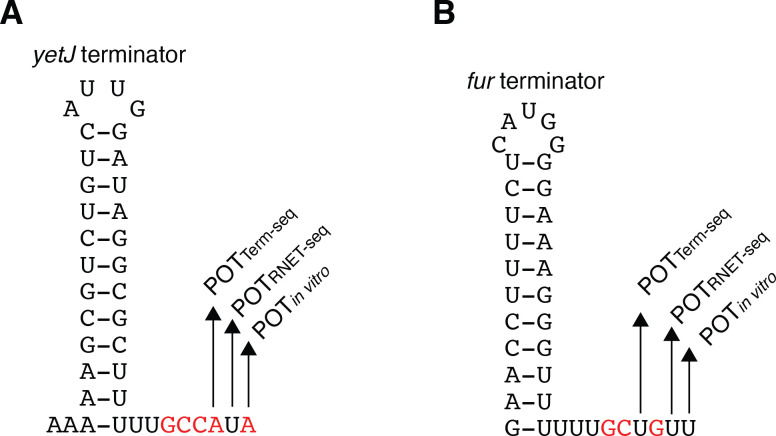
(A) Model of the yetJ terminator showing the point of termination identified in vivo by Term-seq (POTTerm-seq), in vivo by RNET-seq (POTRNET-seq), and by in vitro transcription in the +A+G condition (POTin vitro). (B) Identical to panel A except that it is for the fur terminator.