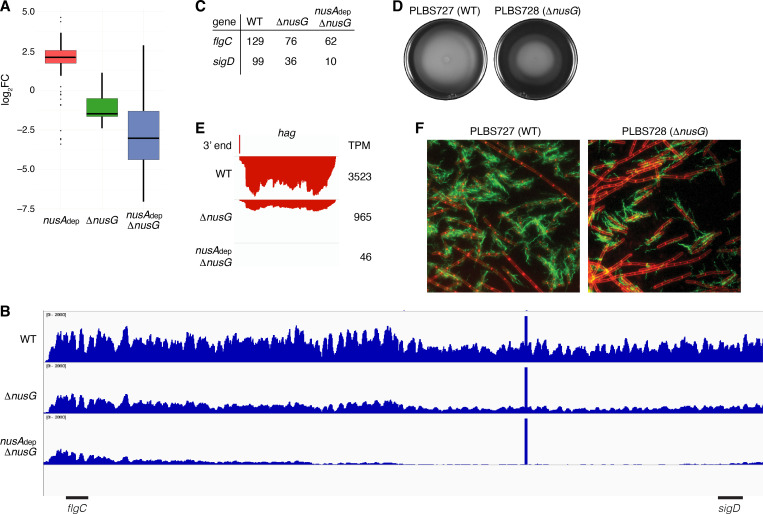
Figure 7. NusG is a motility factor in Bacillus subtilis.
(A) Box plot showing the effect of NusA and/or NusG for all transcripts within the motility regulon; log2 fold change (log2FC) (mutant:WT [wild type]). (B) IGV screenshot of the fla/che operon. Each track is the RNA-seq coverage data for the WT, ΔnusG, and nusAdep ΔnusG strains. Locations of the flgC and sigD genes are specified below the screenshot. (C) Transcripts per million (TPM) values calculated for the flgC and sigD genes in the WT, ΔnusG, and nusAdep ΔnusG strains. (D) Swimming motility assay for PLBS727 (WT) and PLBS728 (ΔnusG). (E) IGV screenshot of the hag transcript. Top track is the 3’ end identified by Term-seq. Bottom tracks are the RNA-seq coverage data for the WT, ΔnusG, and nusAdep ΔnusG strains. Transcription proceeds from right to left. TPM values were calculated for the hag transcript in each strain and are specified to the right of each track. (F) Fluorescence microscopy performed on PLBS727 (WT) and PLBS728 (ΔnusG) strains. Membrane is stained with FM4-64 (false colored red) and flagella are stained with Alexa Fluor 488 C5 maleimide (false colored green).


