
Figure 4.
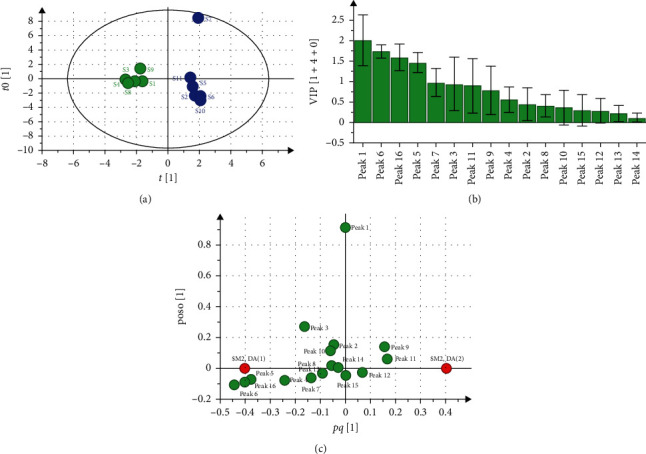
OPLS-DA analysis of 11 batches of AMR. (a) OPLS-DA scatter plot. (b) VIP values. (c) Load scatter plot.
Official websites use .gov
A
.gov website belongs to an official
government organization in the United States.
Secure .gov websites use HTTPS
A lock (
) or https:// means you've safely
connected to the .gov website. Share sensitive
information only on official, secure websites.
OPLS-DA analysis of 11 batches of AMR. (a) OPLS-DA scatter plot. (b) VIP values. (c) Load scatter plot.