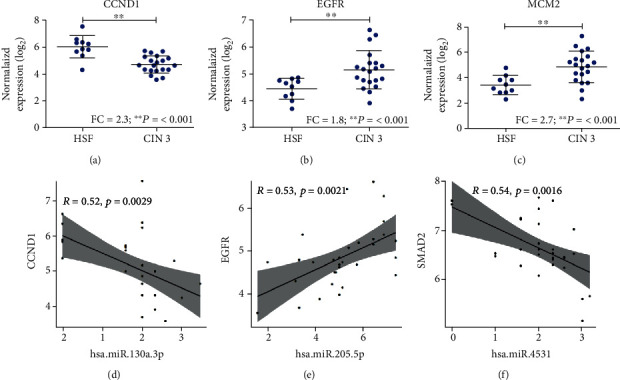
Figure 2.

Gene expression and correlation between miRNA and mRNA target pairs in CIN 3 patients. (a) The expression of CCND1 in CIN 3 and HFS samples. (b) The expression of EGFR in CIN 3 and HFS samples. (c) The expression of MCM2 in CIN 3 and HFS samples. (d) Pearson's correlation analysis between has-miR-130a-3p and CCND1 (Pearson's correlation coefficient, R = −0.52; p = 0.0029). (e) Pearson's correlation analysis between has-miR-205-5p and EGFR (Pearson's correlation coefficient, R = 0.53; p = 0.0021). (f) Pearson's correlation analysis between has-miR-4531 and SMAD2 (Pearson's correlation coefficient, R = −0.54; p = 0.0016). HFS: healthy female subjects (n =11); CIN 3: cervical intraepithelial neoplasia grade 3 (n = 20). ∗∗p value <0.01. Student's t-test was performed to evaluate the gene expression levels between the biological groups.
