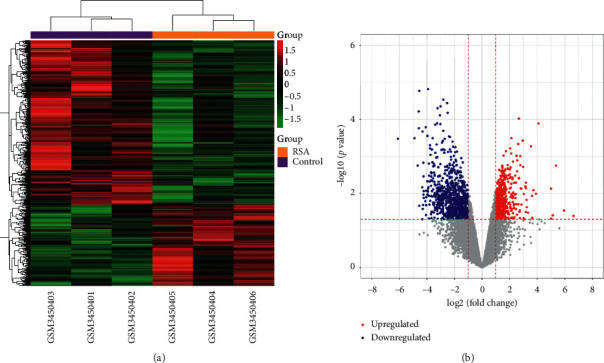
Figure 1.

The differential expression analysis of GSE121950. (a) Heatmap displayed the differentially expressed genes (DEGs). Red and green represent up- and downregulation, respectively. Orange and purple represent recurrent spontaneous abortion (RSA) and control groups, respectively. (b) Volcano plot displayed the DEGs. Red and blue dots represent up- and downregulated genes, respectively.
