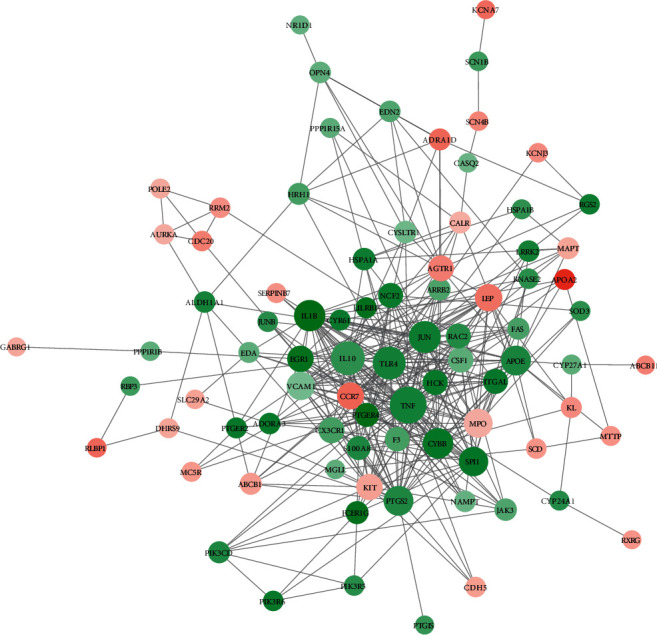
Figure 5.

The protein-protein interaction (PPI) network for the intersected target proteins. The stronger the connection, the larger the dot is. Red and green represent up- and downregulation, respectively. Darker color indicates greater fold change.
