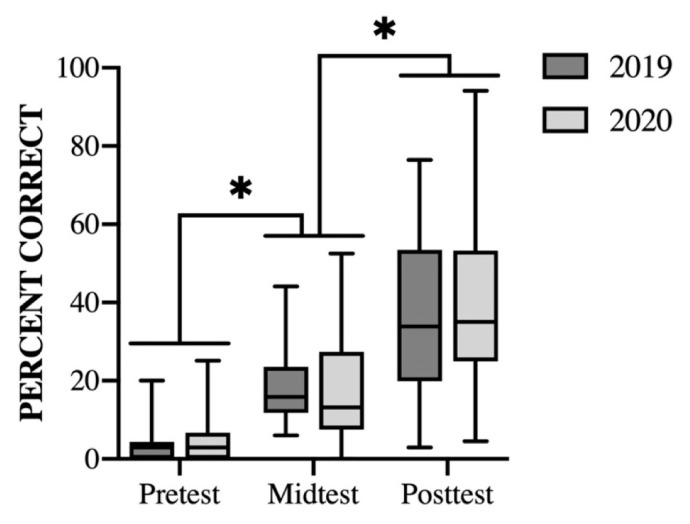
FIGURE 2.
Boxplots of exam spread pre-, mid-, and post-course for each academic term (2019, n = 27; 2020, n = 37). Whiskers indicate minimum to maximum scores, the boxes indicate 25th to 75th percentiles, and middle lines indicate median scores. *, p < 0.001. Exam scores significantly improved through the duration of the term [F(2, 124) = 138.92, p < 0.001]; follow-up t tests with Bonferroni’s correction confirmed that the midtest scores were higher than scores on the pretest [t(62) = 9.97, p < 0.001], and scores on the posttest were higher than scores on the midtest [t(62) = 9.62, p < 0.001]. This pattern did not differ between the 2019 in-person and 2020 remote groups (2, 124) = 0.425, p = 0.655, and there was no difference in exam averages across the two groups, t(62) = 0.17, p = 0.87.

