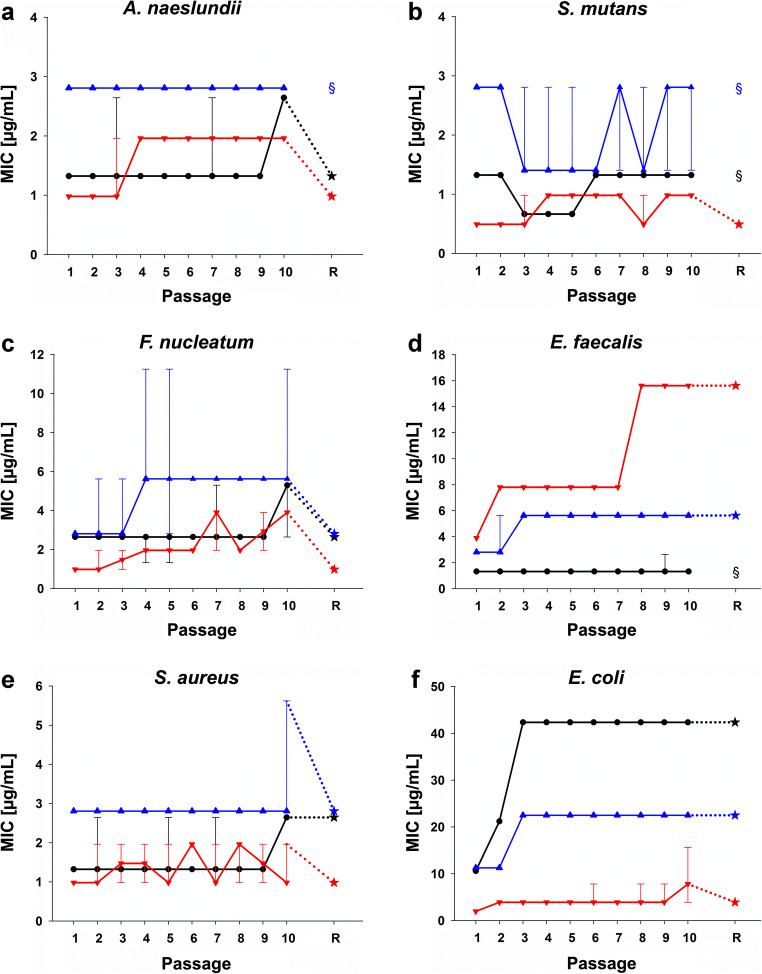
Fig. 3.
Phenotypic adaptation of A. naeslundii (a), S. mutans (b), F. nucleatum (c), E. faecalis (d), S. mutans (e), and E. coli (f) toward CHX (red), CPC (black), and BAC (blue). The ordinates show the respective MICs in μg/mL; the abscissae reflect the passages P1 to P10 and the re-evaluation R. All MICs are depicted as medians, min and max from the values of six independent (P1 to P10) or three independent duplicate (R) experiments. Asterisks depict MICs at R, while paragraphs indicate that no R was performed due to no MIC increase between P1 and P10

