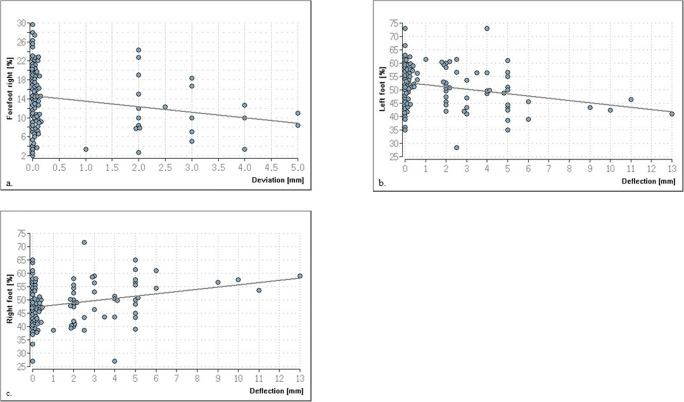
Fig. 6.
Significant correlations between the load of the right forefoot or the left and right entire foot. (a) Illustrates the higher the extent of deviation, the lower the load on the right forefoot results. (b) Illustrates the correlation that the lower the deflection, the higher the load on the left foot results. Similarly, the correlation between deflection and the load on the right foot (c) shows that the greater the deflection, the greater the load on the right foot becomes

