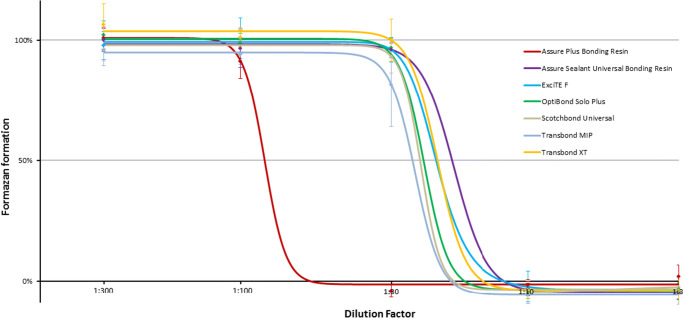
Fig. 1.
Dose response curve for cell viability after treatment of hGfs with different dilutions of adhesives. The sigmoidal curve is the result of the computation via a four-point logistic function to estimate the effective concentration (EC50). The EC50 represents the dilution factor corresponding to the half maximum effect in terms of formazan formation compared with the control (Table 1). The mean levels of formazan formation in cells treated with the respective dilution of different adhesives after 24 h of exposure is shown as diamonds. The presented values have been normalized to untreated control cells (n ≥ 6). Error bars represent the standard deviation of the mean (SDM)

