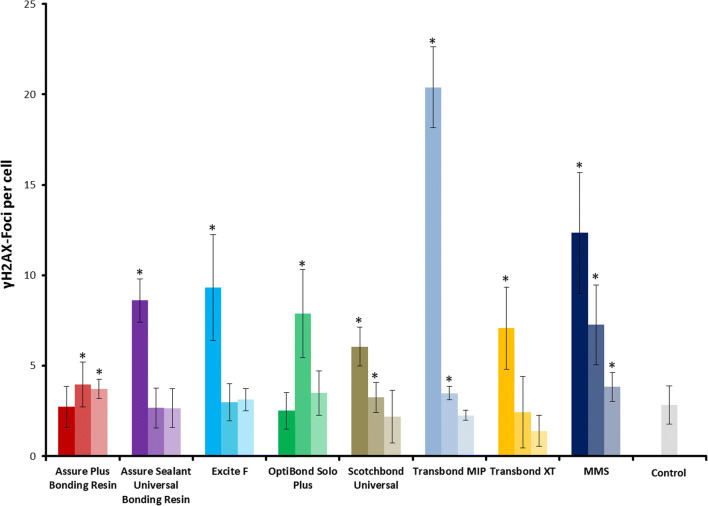
Fig. 3.
Induction of γH2AX foci in human gingival fibroblasts after 6 h of incubation with different methacrylate-based adhesives. The color shading refers to the different concentrations used, corresponding to 1:20, 1:60, and 1:180 for the adhesives and 1 mM, 0.3 mM, and 0.1 mM of methyl methanesulfonate (MMS) as a positive control, respectively. The highest concentration is depicted as saturated color, and lower concentrations are indicated by lighter shades of the corresponding color. The columns represent the mean values with the standard deviation of the mean between experiments (SDM). Data from three independent experiments each analyzing 80 nuclei are shown (n = 240). Asterisks highlight significant differences compared with the control (p ≤ 0.05)

