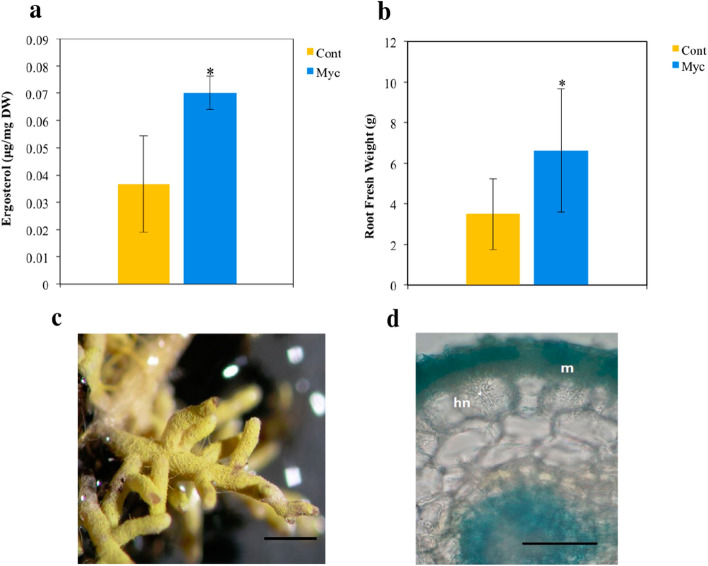
Figure 1.
Fungal root colonization and plant growth of mycorrhizal (Myc) and non-inoculated (Cont) cork oak plants, 8 weeks after P. tinctorius inoculation. (a) Ergosterol root content. Data represent the mean of 3 independent biological replicates (each composed of a pool of 3 individual root systems) ± SD (b) Root fresh weight. Data represent the mean of 15 independent plants ± SD. *Indicates statistical differences at the level P < 0.05 [t-test for (a) and Man-Whitney U test for (b)]. (c) Colonized root showing the hyphal mantle. Scale bar = 1 mm. (d) Representative trypan blue staining of a colonized root showing the fungal mantle (m) and the hartig net (hn). Scale bar = 50 μm.

