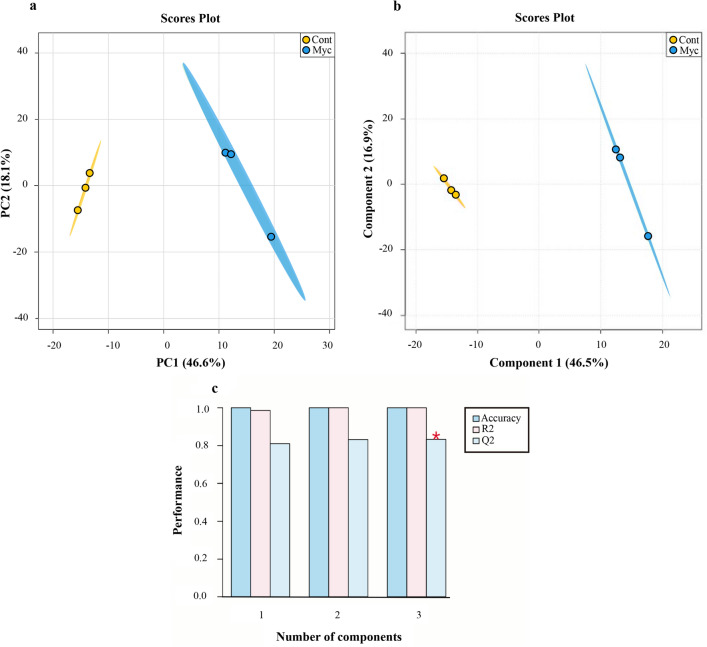
Figure 4.
Overview of the metabolic reprograming analysed by FT-ICR in mycorrhizal and non-inoculated roots interpreted using PCA and PLS-DA. (a) PCA scores plot of mycorrhizal (Myc) and non-inoculated (Cont) cork oak roots. Each point represents a biological replicate (b) PLS-DA scores plot of mycorrhizal (Myc) and non-inoculated (Cont) cork oak roots. Each point represents a biological replicate. (c) Cross-validation scores plot of the PLS-DA for the classification into mycorrhizal and non-inoculated groups using the FT-ICR data as a function of the number of PLS components. The number of components that maximizes Q2 is indicated with a star. Charts were produced with the free available on-line software MetaboAnalyst v4.0 (https://www.metaboanalyst.ca/).

