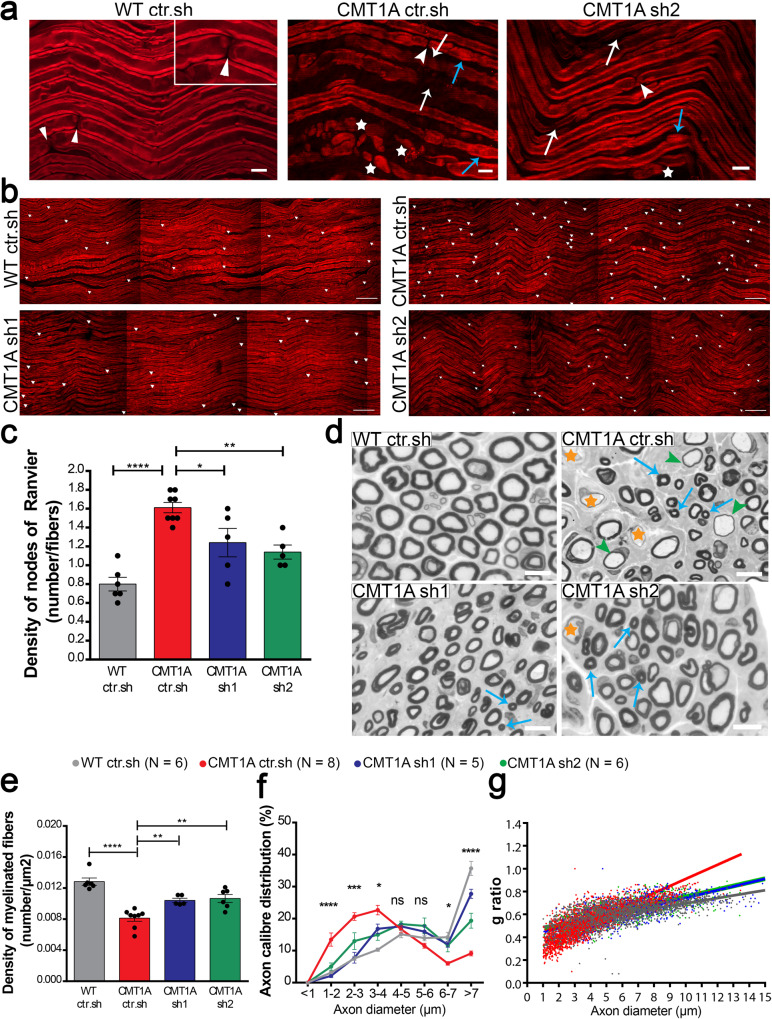
Fig. 4. Intra-nerve injections of AAV2/9-sh1 and sh2 prevent the myelin sheath defects in CMT1A rats.
a, b Representative images of CARS imaging on WT ctr.sh, CMT1A ctr.sh, CMT1A sh1 and CMT1A sh2 rat sciatic nerves twelve months post-injection (n = 6 animals for WT ctr.sh, n = 8 animals for CMT1A ctr.sh, n = 5 animals for CMT1A sh1 and n = 5 animals for CMT1A sh2). a CMT1A ctr.sh nerve shows typical myelin sheath defects such as thin myelin sheath or demyelination (white arrows), focal hypermyelination (blue arrows) and myelin degeneration with myelin ovoids (stars). These defects are less abundant in CMT1A sh2 rat sciatic nerves. The insert represents a zoom of a node of Ranvier (arrowheads). Scale bars: 10 µm and 2 µm for the insert. b Nodes of Ranvier were labeled with arrowheads. Nodes of Ranvier are more abundant in CMT1A ctr.sh sciatic nerves compared to WT ctr.sh nerves indicating shorter internodes. CMT1A sh1 and CMT1A sh2 rat sciatic nerves showed less nodes than CMT1A ctr.sh nerves. Scale bars: 50 µm. c Graph showing the mean number of nodes of Ranvier on the total number of myelinated fibers per field (n = 6 animals for WT ctr.sh, n = 8 animals for CMT1A ctr.sh, n = 5 animals for CMT1A sh1 and n = 5 animals for CMT1A sh2). Statistical test shows one-way ANOVA followed by Tukey’s post hoc, two-sided. ****p < 0.0001 between WT ctr.sh and CMT1A ctr.sh, *p = 0.0271 between CMT1A ctr.sh and CMT1A sh1, **p = 0.0043 between CMT1A ctr.sh and CMT1A sh2. d Representative images of electron microscopy semi thin sections on WT ctr.sh, CMT1A ctr.sh, CMT1A sh1 and CMT1A sh2 rat sciatic nerves twelve months post-injection. CMT1A ctr.sh nerve shows typical myelinated fiber defects such as large demyelinated axons (orange stars), large hypomyelinated axons (green arrowheads) and small hypermyelinated axons (blue arrows). These defects are less abundant in CMT1A sh1 and CMT1A sh2 rat sciatic nerve. Scale bars: 10 µm. Graphs showing e the mean number of myelinated fibers per area unit (µm2), f the mean percentage of axon caliber distribution per axon diameter and g g-ratio relative to axon diameter. (n = 6 animals for WT ctr.sh, n = 8 animals for CMT1A ctr.sh, n = 5 animals for CMT1A and n = 6 animals for CMT1A sh2). Statistical tests show one-way ANOVA followed by Tukey’s post hoc, two-sided (e), ****p < 0.0001 between WT ctr.sh and CMT1A ctr.sh, **p = 0.0082 between CMT1A ctr.sh and CMT1A sh1, **p = 0.002 between CMT1A ctr.sh and CMT1A sh2) or two-way ANOVA followed by Dunnett’s post hoc, two-sided (f), *p < 0.05, ***p < 0.001, ****p < 0.0001 (all p-values of two-sided multiple comparison tests are available in the Source Data File); ns, not significant). All error bars represent SEM. Source data are provided as a Source Data file.

