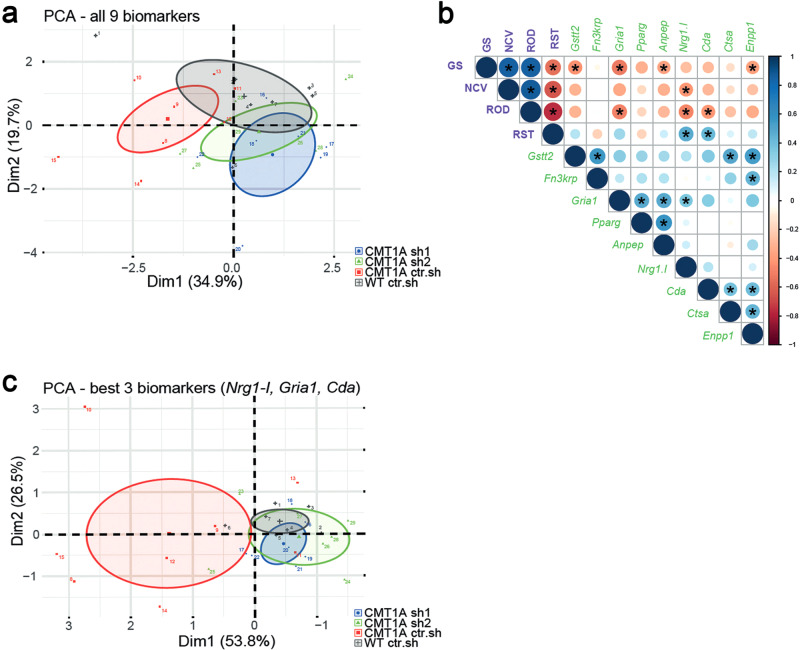
Fig. 6. Multi-variated analysis of skin biomarkers and sensory-motor phenotypes allows the detection of the therapy outcome.
a Principal component analyses (PCA) of all nine transcriptional biomarkers in forepaw skin biopsies on twelve-month-old animals. Note little to no overlap between WT ctr.sh (gray, n = 7) and CMT1A ctr.sh (red, n = 8), whereas the treated groups, CMT1A sh1 (blue, n = 7) and CMT1A sh2 (green, n = 7), show more overlap with the WT ctr.sh group than with the CMT1A ctr.sh group. The mean of each group is given as a center point including the confidence interval (95%) given as an ellipse. b Correlation matrix from all animals (total n = 28 with n = 7 per group) including the expression levels of the skin biomarkers (green labels) and the four functional phenotypic analyses (purple labels): GS, grip strength; NCV, nerve conduction velocity; ROD, Rotarod; RST, Randall-Selitto test). Shown is data from a two-sided Pearson’s correlation analyses with graphical representation of the correlation coefficients, from red (−1) to blue (+1) (indicated by circle size and color), and the respective p-values (asterisks indicate p < 0.05, all the exact p-values are available in the Source Data File). c Principal component analyses (PCA) of the three best biomarkers (Nrg1-I, Gria1, Cda; see correlation matrix in b) in forepaw skin biopsies on twelve-month-old animals (same analysis as in a). Source data are provided as a Source Data file.

