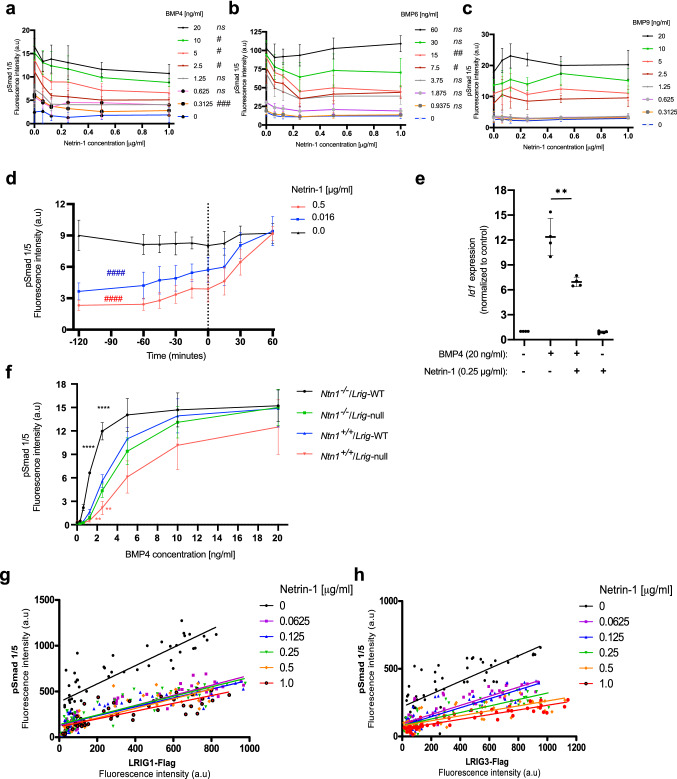
Figure 1.
Netrin-1 inhibits BMP signaling in MEFs. (a–c) Wild-type MEFs were starved in serum-free medium and then treated with various concentrations of BMP4, BMP6, or BMP9 together with various concentrations of netrin-1 for an hour. Then, BMP signaling was assessed via the analysis of nuclear pSmad1/5 levels. The graphs show the average means with error bars showing the standard deviations of three independent experiments performed in duplicate (one-way ANOVA: nsp ≥ 0.05; #p < 0.05; ##p < 0.01; ###p < 0.001). (d) Wild-type MEFs were treated with various concentrations of netrin-1 at different times before, with, or after the addition of BMP4 [5 ng/ml] to the wells. One hour after the addition of BMP4, BMP signaling was assessed via the analysis of nuclear pSmad1/5 levels. The x-axis shows the time at which netrin-1 was added relative to the addition of BMP4: negative values indicate the addition of netrin-1 before the addition of BMP4, ‘0′ indicates the simultaneous addition of netrin-1 and BMP4, and positive values indicate the addition of netrin-1 after the addition of BMP4. The graph shows the average means with the standard deviations of four independent experiments performed in duplicate (one-way ANOVA: ####p < 0.0001). (e) Id1 mRNA expression levels in response to BMP4 and netrin-1. MEFs were treated, or not, with 20 ng/ml BMP4 and/or 0.25 μg/ml netrin-1 for x hours followed by analysis of RNA expression levels through real-time qRT-PCR. Shown are the Id1 levels normalized to the Rn18s levels. The graph represents the average means with standard deviations of four independent experiments performed in duplicate (Student’s t-test: **p < 0.01; ***p < 0.001). (f) MEFs of different Ntn1 and Lrig genotypes (Ntn1+/+ or Ntn1−/− and Lrig-wild-type or Lrig-null [Lrig1−/−;Lrig2−/−;Lrig3−/−], respectively) were treated with various concentrations of BMP4, and BMP signaling was assessed via analysis of the nuclear pSmad1/5 levels. The graph shows the means with the standard deviations of four Ntn1+/+;Lrig-wild-type or Ntn1+/+;Lrig-null biological replicates and three Ntn1−/−;Lrig-wild-type or Ntn1−/−;Lrig-null biological replicates determined through three independent experimental repeats. The error bars represent the standard deviations (Student’s t-test: **p < 0.01; ****p < 0.0001. Colors of asterisks represent the respective genotype, according to the graph symbols, compared to Ntn1+/+;Lrig-WT). (g, h) Cross-titration of netrin-1 and LRIG1 (g) or LRIG3 (h). LRIG1- or LRIG3-inducible Lrig-null and Ntn1−/− MEFs were treated with different concentrations of doxycycline (between 0 and 1 μg/ml) to induce various levels of LRIG protein expression. BMP signaling was induced using 5 ng/ml BMP4 together with different amounts of netrin-1 (between 0 and 1 μg/ml) for an hour. The fluorescence response for the nuclear pSmad1/5 levels induced by BMP4 is plotted on the y-axis. The doxycycline-induced expression levels of FLAG-tagged LRIG1 or LRIG3 were measured and plotted on the x-axis. Each dot represents the quantification of pSmad1/5 and LRIG-FLAG from each measurement. The graphs show data obtained from three independent experiments performed in duplicate for each concentration of netrin-1 and doxycycline. The R2 values for the scattered plots are tabulated in Tables 1 and 2.

