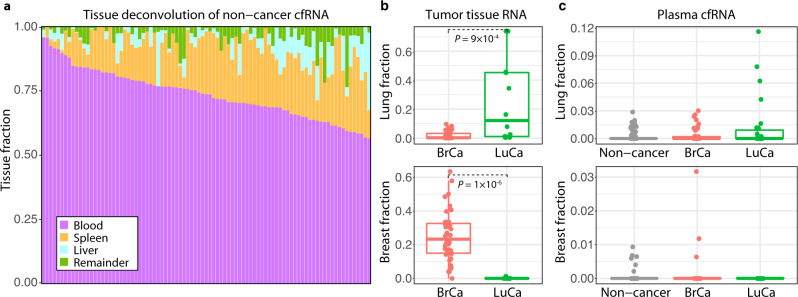
Fig. 2. Tissue deconvolution of RNA from plasma and tissue samples.
a Tissue deconvolution for cell-free RNA (cfRNA) from 89 non-cancer plasma participants. Each stacked bar represents a single participant. b Lung and breast fraction distribution in RNA from matched tumor tissue obtained from 40 breast cancer (BrCa) and 11 lung cancer (LuCa) patients. P values from the two-sided Wilcoxon rank-sum method indicate significance levels for differences in tissue-specific fractions across sample groups. c Lung and breast fraction distribution in plasma-derived cfRNA from different sample groups (46 BrCa, 28 LuCa, 89 non-cancer). Boxplots indicate the 25% (lower hinge), 50% (horizontal line), and 75% quantiles (upper hinge) of the tissue fraction distribution, with whiskers that indicate observations outside the hinge ± 1.5 x interquartile range (IQR). Outliers (beyond 1.5 × IQR) are plotted individually.

