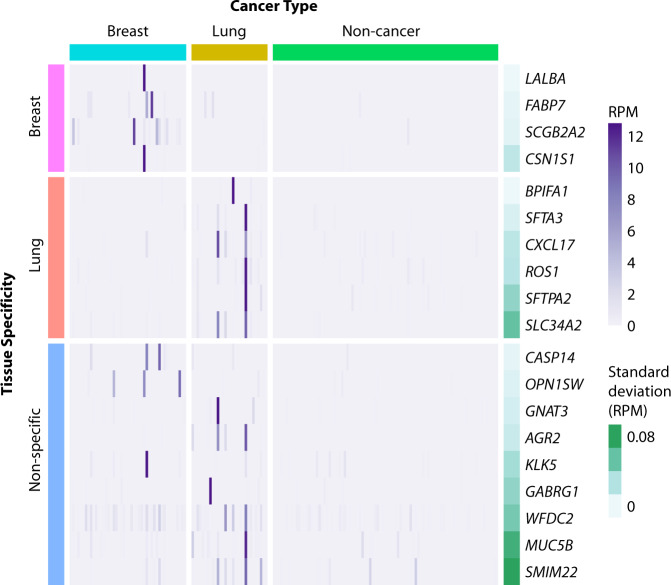
Fig. 3. Dark channel biomarker (DCB) expression in cell-free RNA from breast, lung, and non-cancer plasma samples.
Samples are shown in columns and DCB genes in rows. Cancer type is indicated above the heatmap, and the tissue specificity of each DCB, as annotated in the Human Protein Atlas (version 18.1), is indicated on the left side of the heatmap. Gene expression values in reads per million (RPM) are represented by the purple gradient and are scaled for visualization purposes. Darkness in non-cancer plasma samples is illustrated by the standard deviation of RPM (green gradient bar) as shown on the right side of the heatmap.

