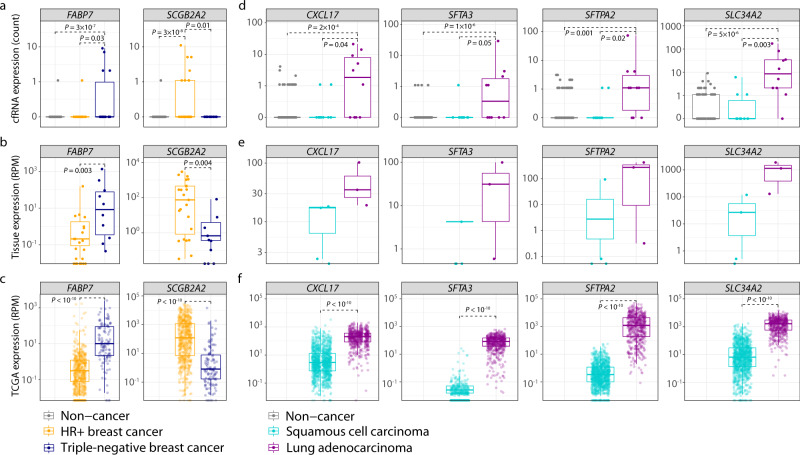
Fig. 4. Dark channel biomarker (DCB) genes exhibit cancer and subtype-specific expression in cfRNA and tumor tissue.
Expression (strict counts) of breast cancer-specific DCBs in a cfRNA of breast cancer (n = 24 HR+, n = 14 triple negative) and non-cancer participants (n = 89), and in b matched breast tumor biopsies (n = 23 HR+, n = 10 triple-negative). c Expression (RPM) of RNA in breast tumor tissue (n = 575 HR+, n = 115 triple-negative) from The Cancer Genome Atlas (TCGA). Expression (strict counts) of lung cancer-specific DCBs in d cfRNA of lung cancer (n = 10 adenocarcinoma, 10 squamous cell carcinoma) and non-cancer participants (n = 89), and in e matched lung tumor biopsies (n = 4 squamous cell carcinoma, n = 3 adenocarcinoma). f Expression (RPM) of RNA in lung tumor tissue (n = 1102 squamous cell carcinoma, n = 533 adenocarcinoma) from TCGA. P values from the two-sided Wilcoxon rank-sum method indicate significance levels for differential expression between cancer subtypes. Boxplots indicate the 25% (lower hinge), 50% (horizontal line), and 75% quantiles (upper hinge), with whiskers that indicate observations outside the hinge ± 1.5 × interquartile range (IQR). Outliers (beyond 1.5 × IQR) are plotted individually.

