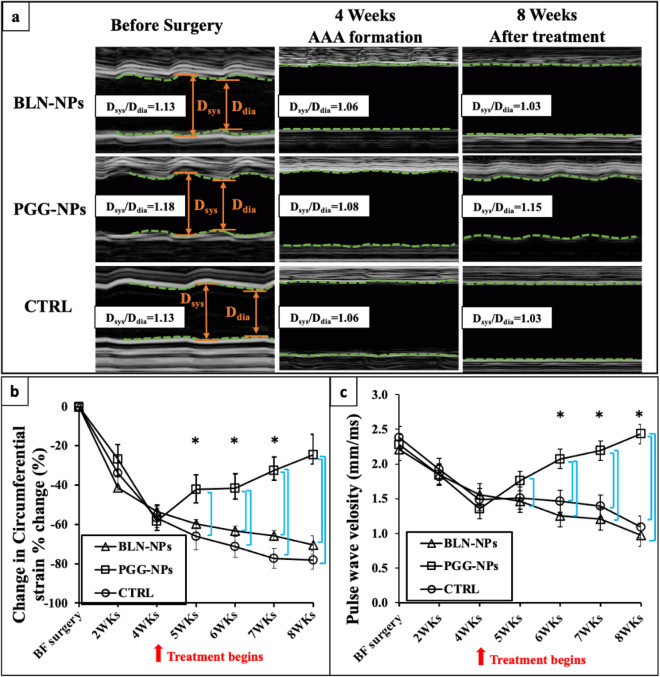
Figure 4.
Circumferential strains (CS) and pulse wave velocity (PWV). (a) Representative M-mode in-vivo ultrasound images of abdominal aortas before pump implantation, at 4 weeks after infusion of Ang II, and at 8 weeks at the end of therapy, showing the mechanical behavior change within a cardiac cycle for PGG-NPs, BLN-NPs and control groups; (b) Percent change of corresponding circumferential Green–Lagrange strains throughout the cardiac cycle at weeks 2 and 4, and during the treatment at weeks 5, 6, 7 and 8. All aneurysmal aortas showed a reduction in CS after formation of the aneurysms. After treatments, PGG-NPs group showed a progressive increase of the CS while the CS of the BLN-NPs group and control group kept decreasing; (c) Corresponding PWV at weeks 2 and 4, and during the treatment at weeks 5, 6, 7 and 8. All aneurysmal aortas showed a reduction in the PWV after formation of the aneurysms at 4 week. After treatments, PGG-NPs group showed an increase of the pulse wave velocity, while the pulse wave velocity of the BLN-NPs group and the control group kept decreasing due to further aortic dilation. * indicate timepoint that have dilation percentage significantly different from week 4 (p < 0.05); bars indicate significant difference between groups (p < 0.05).

