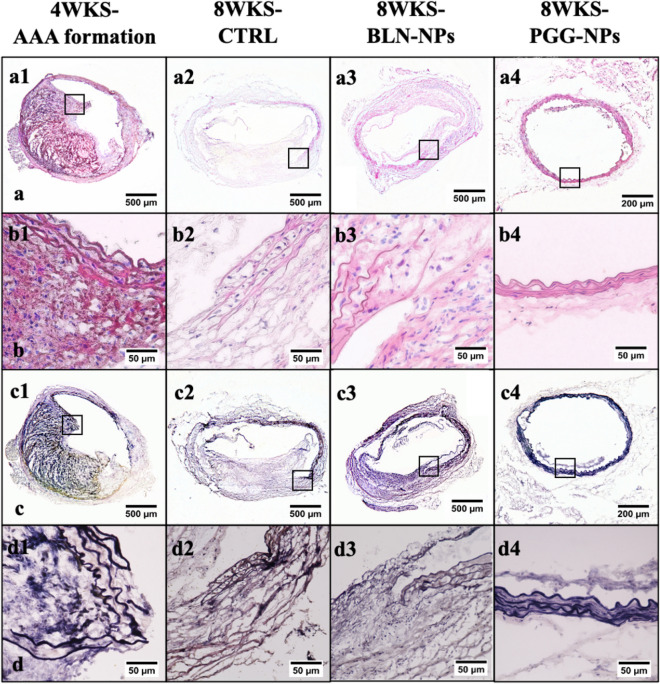
Figure 5.
Histological analysis. (a,b) H&E staining for aneurysms; BLN-NPs, control and PGG-NPs groups are at lower (a1–4) and higher (b1–4) magnifications, showing the morphology and the cell infiltration of the suprarenal aortic tissue. The PGG-NPs group had better morphology and minimal cell infiltration compared to the other groups (the opening shown in a4 and d4 was a vessel branching out from the aorta); (c,d) VVG staining for aneurysms; BLN-NPs, control and PGG-NPs groups are at lower (c1–4) and higher (d1–4) magnifications, showing the elastin damage within the tissue. The elastic laminae in the PGG-NPs were repaired as compared to before therapy while in other groups they continued to degrade.

