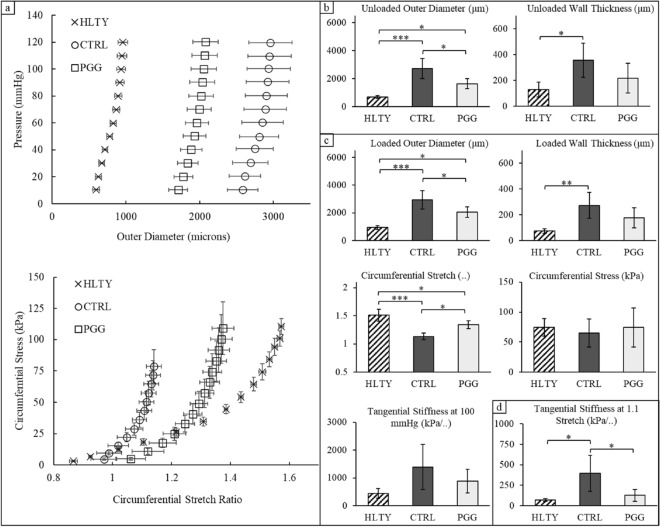
Figure 8.
Ex vivo mechanical testing of aneurysmal aortas. Tissues were taken from age-matched healthy (HLTY; n = 5), Ang-II infused aneurysmal controls (CTRL; n = 5), and Ang-II infused aneurysmal pentagalloyl glucose (PGG-NPs; n = 5)-treated animals. (a) Pressure-outer diameter and stress-stretch curves measured during continuous inflation- extension testing. Discrete values of tissues in the (b) unloaded state, (c) physiologically loaded state, and (d) at a common stretch ratio. Scatter-plots are mean ± SEM and bar charts (b-d) are mean ± STD. ***p < 0.01, **p < 0.05, *p < 0.1.

