Figure 2.
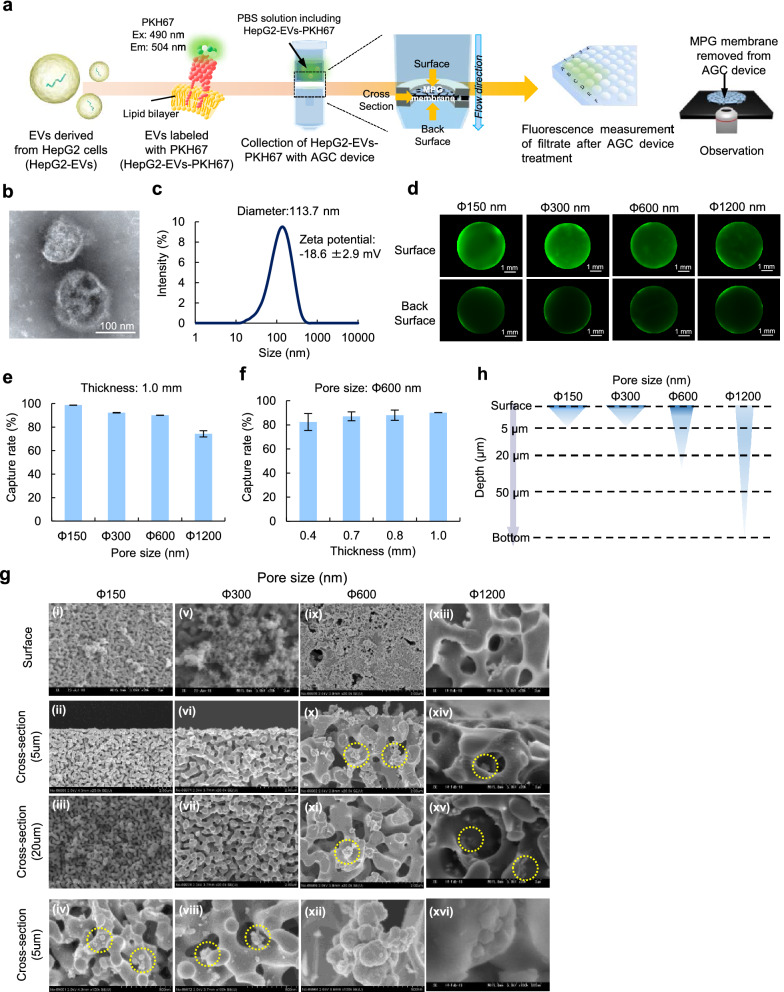
EV collection using the AGC device. (a) A schematic illustration of EV collection using the AGC device and the evaluation of the collection efficiency using a plate reader and fluorescence microscope. (b) A TEM image of EVs derived from HepG2 cells (HepG2-EVs). (c) The size and zeta potential distribution of HepG2-EVs. (d) A fluorescence image of an MPG membrane after the collection of HepG2-EVs labeled with PKH67 (green fluorescence) using the AGC device. (e,f) The capture rate (%) of HepG2-EVs by MPG membranes of different pore size (e) and thickness (f). (g) A SEM image of HepG2-EVs collected in MPG membranes with different pore sizes. (h) The schematic illustration demonstrating the depth at which HepG2-EVs could be observed in the MPG membrane with different pore sizes.

