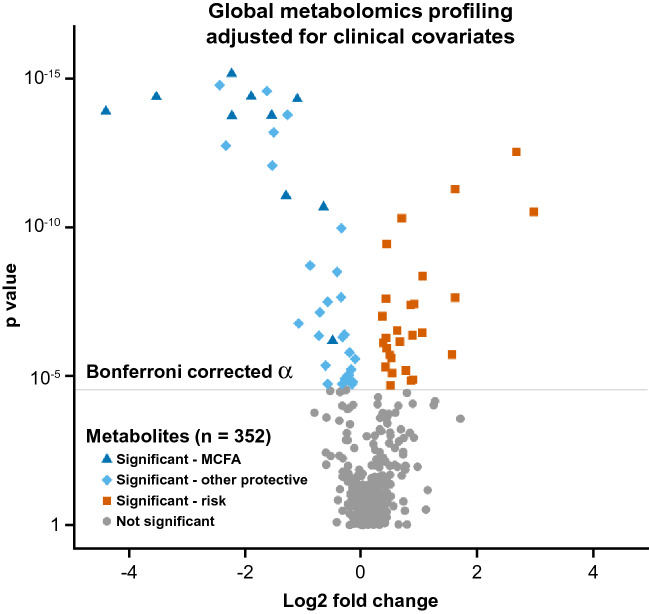
Figure 1.
Global analysis of metabolite associations with recent, persistent normoalbuminuria in subjects with long duration of T1D and normal renal function. The analysis is adjusted for clinical covariates. Well-detectable metabolites are shown. The magnitude of the effect is shown as fold change (x-axis) cross-referenced against the strength of the associations represented as significance from the logistic regression model adjusted for clinical covariates (y-axis). The grey line marks the threshold of significance at Bonferroni corrected α = 0.000028. Each point represents an individual metabolite. Dark blue triangles mark significant Medium Chain Fatty Acids. Light blue diamonds mark other significant protective metabolites. Orange squares mark significant risk metabolites. MCFA Medium Chain Fatty Acid.

