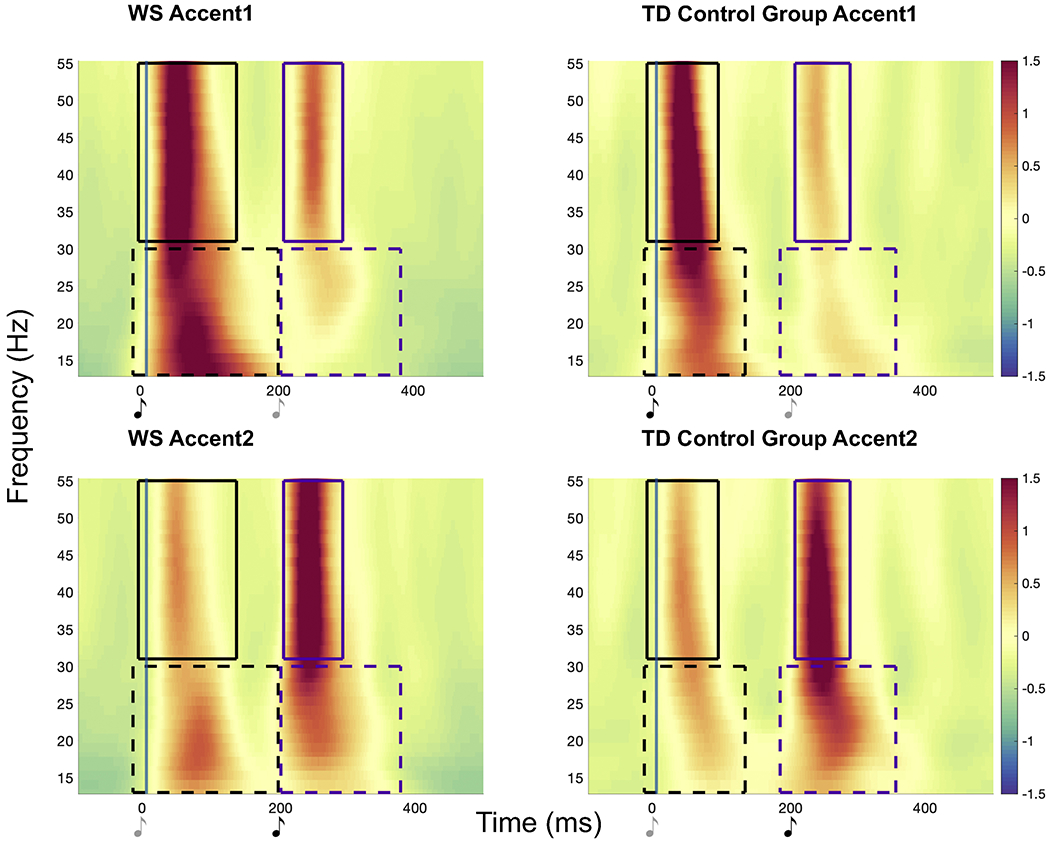
Figure 1.

Time-frequency representations of normalized change in power in beta and gamma evoked activity, shown as an average across all electrodes, for both groups in Accent1 and Accent2 conditions. Significant neural activity in each frequency band (Beat1 effect in black and Beat2 effect in purple) is denoted by a box extending through the significant latency of activity, and these boxes represent between condition clustering. Dark music notes indicate accented tones and lighter notes indicate unaccented tones. Increases in evoked activity are time-locked to the physically accented tone (perceived as the beat) in both conditions in both WS and TD groups.
