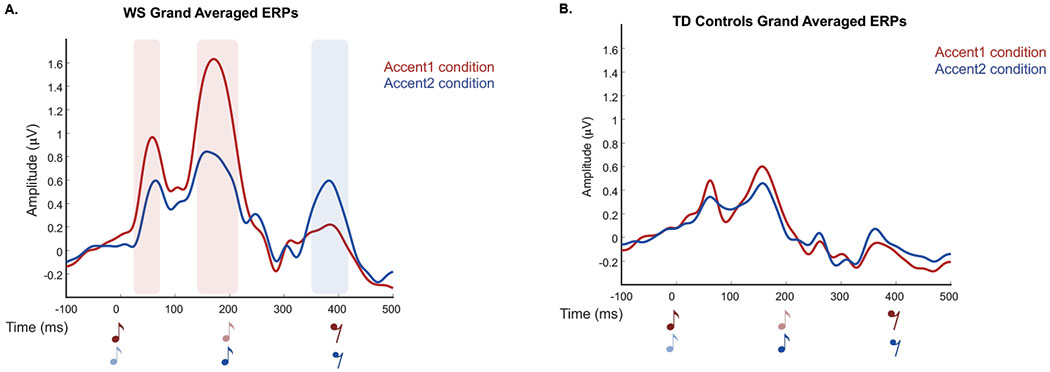
Figure 4.

ERP responses for WS group (A) and TD controls (B) in both conditions for ten central electrodes. Red=Accent1, Blue=Accent2. Dark music notes indicate accented tones and lighter notes indicate unaccented tones. Shaded areas indicate significant amplitude differences between the two conditions (color coded), which were only evident in the WS group.
